Spotlight (2015)

Spotlight poster
Theatrical Performance
Domestic Box Office $45,055,776Details
International Box Office $46,846,662Details
Worldwide Box Office $91,902,438
Home Market Performance
Est. Domestic DVD Sales $2,396,573 Details
Est. Domestic Blu-ray Sales $2,716,282 Details
Total Est. Domestic Video Sales $5,112,855
Further financial details...

Synopsis

The true story of the Pulitzer Prize-winning Boston Globe investigation that would rock the city and cause a crisis in one of the world’s oldest and most trusted institutions. When the newspaper’s tenacious “Spotlight” team of reporters delve into allegations of abuse in the Catholic Church, their year-long investigation uncovers a decades-long cover-up at the highest levels of Boston’s religious, legal, and government establishment, touching off a wave of revelations around the world.

Metrics

Opening Weekend:$295,009 (0.7% of total gross)
Legs:10.22 (domestic box office/biggest weekend)
Domestic Share:49.0% (domestic box office/worldwide)
Production Budget:$20,000,000 (worldwide box office is 4.6 times production budget)
Theater counts:5 opening theaters/1,227 max. theaters, 11.5 weeks average run per theater
Infl. Adj. Dom. BO $57,032,107

Latest Ranking on Cumulative Box Office Lists


Watch Now On

Amazon VOD:Amazon
iTunes:iTunes
Google Play:Google Play, Google Play
Vudu:Vudu

Movie Details

Domestic Releases: November 6th, 2015 (Limited) by Open Road
International Releases: January 7th, 2016 (Wide) (Brazil)
January 7th, 2016 (Wide) (Central America)
January 7th, 2016 (Wide) (Colombia)
January 14th, 2016 (Wide) (Dominican Republic)
January 14th, 2016 (Wide) (Thailand)
... Show all releases
Video Release: February 2nd, 2016 by Universal Home Entertainment
MPAA Rating: R for some language including sexual references.
(Rating bulletin 2386, 8/12/2015)
Running Time: 128 minutes
Comparisons: Best Picture Oscar Winners
Best Picture Oscar Nominees, 2016
vs. Trumbo
Create your own comparison chart…
Keywords: 2016 Oscars Best Picture Nominee, Oscars Best Picture Winner, Investigative Journalist, Sex Crimes, Child Abuse, Dysfunctional Family, Government Corruption, Docudrama
Source:Based on Real Life Events
Genre:Drama
Production Method:Live Action
Creative Type:Dramatization
Production/Financing Companies: Anonymous Content, Rocklin/Faust, Open Road Films, Participant Media, First Look Media, Topic
Production Countries: United States
Languages: English

Ranking on other Records and Milestones

RecordRankAmountChart
Date
Days In
Release
Biggest 26th Weekend Limited Release 24 $95,676 Apr 29, 2016 178
Biggest 25th Weekend Limited Release 77 $31,253 Apr 22, 2016 171
Biggest 24th Weekend Limited Release 65 $45,247 Apr 15, 2016 164
Biggest 23rd Weekend Limited Release 53 $79,473 Apr 8, 2016 157
Biggest 22nd Weekend Limited Release 43 $151,034 Apr 1, 2016 150
Biggest 21st Weekend Limited Release 51 $158,087 Mar 25, 2016 143
Biggest 20th Weekend Limited Release 26 $423,465 Mar 18, 2016 136
Biggest Domestic 19th Weekend 69 $931,412 Mar 11, 2016 129
Biggest 19th Weekend Limited Release 13 $931,412 Mar 11, 2016 129
Biggest Domestic 18th Weekend 48 $1,766,212 Mar 4, 2016 122
Biggest 18th Weekend Limited Release 9 $1,766,212 Mar 4, 2016 122
Biggest 17th Weekend Limited Release 33 $735,999 Feb 26, 2016 115
Biggest 16th Weekend Limited Release 50 $522,353 Feb 19, 2016 108
Biggest 15th Weekend Limited Release 48 $698,951 Feb 12, 2016 101
Biggest 14th Weekend Limited Release 48 $835,514 Feb 5, 2016 94
Biggest 13th Weekend Limited Release 40 $1,200,039 Jan 29, 2016 87
Biggest 12th Weekend Limited Release 38 $1,273,626 Jan 22, 2016 80
Biggest 11th Weekend Limited Release 35 $1,650,133 Jan 15, 2016 73
Biggest 10th Weekend Limited Release 71 $928,471 Jan 8, 2016 66
Biggest 9th Weekend Limited Release 67 $1,185,093 Jan 1, 2016 59
Biggest 8th Weekend Limited Release 94 $1,083,976 Dec 25, 2015 52
Biggest 7th Weekend Limited Release 83 $1,425,193 Dec 18, 2015 45
Biggest 6th Weekend Limited Release 46 $2,508,853 Dec 11, 2015 38
Biggest 5th Weekend Limited Release 52 $2,800,008 Dec 4, 2015 31
Biggest 4th Weekend Limited Release 24 $4,408,252 Nov 27, 2015 24
Thanksgiving (All Movies, 3-Day, Inflation Adjusted) 353 $5,626,792 Nov 27, 2015 24
Thanksgiving (All Movies, 5-Day) 268 $5,639,121 Nov 27, 2015 24
Thanksgiving (All Movies, 5-Day, Inflation Adjusted) 310 $5,999,342 Nov 27, 2015 24
Biggest 3rd Weekend Limited Release 30 $3,528,384 Nov 20, 2015 17
Top 2015 Theater Average 9 $59,002 Nov 6, 2015 3
Widest Expansion Limited Release 55 1,222 Nov 6, 2015 0

Compare this performance with other movies…

Domestic Cumulative Box Office Records

Weekend Box Office Performance

DateRankGross% ChangeTheatersPer TheaterTotal GrossWeek
Nov 6, 2015 23 $295,009   5 $59,002   $295,009 1
Nov 13, 2015 12 $1,353,630 +359% 60 $22,561   $1,800,400 2
Nov 20, 2015 8 $3,528,384 +161% 598 $5,900   $5,804,495 3
Nov 27, 2015 8 $4,408,252 +25% 897 $4,914   $12,260,141 4
Dec 4, 2015 8 $2,800,008 -36% 980 $2,857   $16,505,705 5
Dec 11, 2015 9 $2,508,853 -10% 1,089 $2,304   $20,302,802 6
Dec 18, 2015 12 $1,425,193 -43% 825 $1,728   $22,803,219 7
Dec 25, 2015 17 $1,083,976 -24% 480 $2,258   $24,899,059 8
Jan 1, 2016 15 $1,185,093 +9% 385 $3,078   $27,108,972 9
Jan 8, 2016 17 $928,471 -22% 368 $2,523   $28,546,477 10
Jan 15, 2016 14 $1,650,133 +78% 985 $1,675   $30,623,296 11
Jan 22, 2016 16 $1,273,626 -23% 1,030 $1,237   $32,902,971 12
Jan 29, 2016 15 $1,200,039 -6% 715 $1,678   $34,765,827 13
Feb 5, 2016 17 $835,514 -30% 668 $1,251   $36,104,348 14
Feb 12, 2016 20 $698,951 -16% 455 $1,536   $37,204,863 15
Feb 19, 2016 26 $522,353 -25% 401 $1,303   $38,102,424 16
Feb 26, 2016 21 $735,999 +41% 685 $1,074   $39,121,520 17
Mar 4, 2016 15 $1,766,212 +140% 1,227 $1,439   $41,562,351 18
Mar 11, 2016 16 $931,412 -47% 847 $1,100   $43,187,686 19
Mar 18, 2016 20 $423,465 -55% 443 $956   $44,000,003 20
Mar 25, 2016 25 $158,087 -63% 206 $767   $44,338,925 21
Apr 1, 2016 28 $151,034 -4% 202 $748   $44,571,689 22
Apr 8, 2016 35 $79,473 -47% 112 $710   $44,726,885 23
Apr 15, 2016 37 $45,247 -43% 103 $439   $44,808,479 24
Apr 22, 2016 41 $31,253 -31% 91 $343   $44,867,903 25
Apr 29, 2016 33 $95,676 +206% 224 $427   $44,988,180 26

Daily Box Office Performance

DateRankGross%YD%LWTheatersPer TheaterTotal GrossDays
Nov 6, 2015 - $89,387     5 $17,877   $89,387 1
Nov 7, 2015 - $118,272 +32%   5 $23,654   $207,659 2
Nov 8, 2015 - $87,350 -26%   5 $17,470   $295,009 3
Nov 9, 2015 - $35,108 -60%   5 $7,022   $330,117 4
Nov 10, 2015 - $33,370 -5%   5 $6,674   $363,487 5
Nov 11, 2015 - $53,126 +59%   5 $10,625   $416,613 6
Nov 12, 2015 - $30,157 -43%   5 $6,031   $446,770 7
Nov 13, 2015 12 $390,951 +1,196% +337% 60 $6,516   $837,721 8
Nov 14, 2015 11 $575,688 +47% +387% 60 $9,595   $1,413,409 9
Nov 15, 2015 11 $386,991 -33% +343% 60 $6,450   $1,800,400 10
Nov 16, 2015 9 $120,839 -69% +244% 60 $2,014   $1,921,239 11
Nov 17, 2015 14 $125,187 +4% +275% 60 $2,086   $2,046,426 12
Nov 18, 2015 8 $121,068 -3% +128% 60 $2,018   $2,167,494 13
Nov 19, 2015 9 $108,617 -10% +260% 60 $1,810   $2,276,111 14
Nov 20, 2015 7 $1,025,097 +844% +162% 598 $1,714   $3,301,208 15
Nov 21, 2015 8 $1,517,144 +48% +164% 598 $2,537   $4,818,352 16
Nov 22, 2015 8 $986,143 -35% +155% 598 $1,649   $5,804,495 17
Nov 23, 2015 8 $355,011 -64% +194% 598 $594   $6,159,506 18
Nov 24, 2015 8 $461,514 +30% +269% 598 $772   $6,621,020 19
Nov 25, 2015 8 $652,981 +41% +439% 897 $728   $7,274,001 20
Nov 26, 2015 10 $577,888 -12% +432% 897 $644   $7,851,889 21
Nov 27, 2015 8 $1,657,861 +187% +62% 897 $1,848   $9,509,750 22
Nov 28, 2015 8 $1,740,754 +5% +15% 897 $1,941   $11,250,504 23
Nov 29, 2015 7 $1,009,637 -42% +2% 897 $1,126   $12,260,141 24
Nov 30, 2015 6 $333,180 -67% -6% 897 $371   $12,593,321 25
Dec 1, 2015 7 $410,895 +23% -11% 897 $458   $13,004,216 26
Dec 2, 2015 6 $361,588 -12% -45% 897 $403   $13,365,804 27
Dec 3, 2015 6 $339,893 -6% -41% 897 $379   $13,705,697 28
Dec 4, 2015 7 $830,428 +144% -50% 980 $847   $14,536,125 29
Dec 5, 2015 8 $1,270,555 +53% -27% 980 $1,296   $15,806,680 30
Dec 6, 2015 8 $699,025 -45% -31% 980 $713   $16,505,705 31
Dec 7, 2015 7 $286,600 -59% -14% 980 $292   $16,792,305 32
Dec 8, 2015 7 $372,580 +30% -9% 980 $380   $17,164,885 33
Dec 9, 2015 7 $312,967 -16% -13% 980 $319   $17,477,852 34
Dec 10, 2015 7 $316,097 +1% -7% 980 $323   $17,793,949 35
Dec 11, 2015 8 $711,126 +125% -14% 1,089 $653   $18,505,075 36
Dec 12, 2015 9 $1,123,579 +58% -12% 1,089 $1,032   $19,628,654 37
Dec 13, 2015 9 $674,148 -40% -4% 1,089 $619   $20,302,802 38
Dec 14, 2015 8 $269,659 -60% -6% 1,089 $248   $20,572,461 39
Dec 15, 2015 8 $312,804 +16% -16% 1,089 $287   $20,885,265 40
Dec 16, 2015 8 $278,396 -11% -11% 1,089 $256   $21,163,661 41
Dec 17, 2015 8 $214,365 -23% -32% 1,089 $197   $21,378,026 42
Dec 18, 2015 12 $355,889 +66% -50% 825 $431   $21,733,915 43
Dec 19, 2015 10 $644,159 +81% -43% 825 $781   $22,378,074 44
Dec 20, 2015 11 $425,145 -34% -37% 825 $515   $22,803,219 45
Dec 21, 2015 11 $238,081 -44% -12% 825 $289   $23,041,300 46
Dec 22, 2015 12 $276,174 +16% -12% 825 $335   $23,317,474 47
Dec 23, 2015 12 $251,318 -9% -10% 825 $305   $23,568,792 48
Dec 24, 2015 12 $246,291 -2% +15% 825 $299   $23,815,083 49
Dec 25, 2015 - $322,037 +31% -10% 480 $671   $24,137,120 50
Dec 26, 2015 - $418,648 +30% -35% 480 $872   $24,555,768 51
Dec 27, 2015 - $343,291 -18% -19% 480 $715   $24,899,059 52
Dec 28, 2015 - $243,737 -29% +2% 480 $508   $25,142,796 53
Dec 29, 2015 - $246,174 +1% -11% 480 $513   $25,388,970 54
Dec 30, 2015 15 $263,502 +7% +5% 480 $549   $25,652,472 55
Dec 31, 2015 15 $271,407 +3% +10% 480 $565   $25,923,879 56
Jan 1, 2016 15 $426,538 +57% +32% 385 $1,108   $26,350,417 57
Jan 2, 2016 15 $486,253 +14% +16% 385 $1,263   $26,836,670 58
Jan 3, 2016 - $272,302 -44% -21% 385 $707   $27,108,972 59
Jan 4, 2016 - $114,365 -58% -53% 385 $297   $27,223,337 60
Jan 5, 2016 - $131,521 +15% -47% 385 $342   $27,354,858 61
Jan 6, 2016 - $131,565 n/c -50% 385 $342   $27,486,423 62
Jan 7, 2016 - $131,583 n/c -52% 385 $342   $27,618,006 63
Jan 8, 2016 - $246,724 +88% -42% 368 $670   $27,864,730 64
Jan 9, 2016 - $434,234 +76% -11% 368 $1,180   $28,298,964 65
Jan 10, 2016 - $247,513 -43% -9% 368 $673   $28,546,477 66
Jan 11, 2016 - $89,105 -64% -22% 368 $242   $28,635,582 67
Jan 12, 2016 - $103,362 +16% -21% 368 $281   $28,738,944 68
Jan 13, 2016 - $106,463 +3% -19% 368 $289   $28,845,407 69
Jan 14, 2016 - $127,756 +20% -3% 368 $347   $28,973,163 70
Jan 15, 2016 14 $448,142 +251% +82% 985 $455   $29,421,305 71
Jan 16, 2016 14 $667,773 +49% +54% 985 $678   $30,089,078 72
Jan 17, 2016 14 $534,218 -20% +116% 985 $542   $30,623,296 73
Jan 18, 2016 13 $422,032 -21% +374% 985 $428   $31,045,328 74
Jan 19, 2016 13 $217,236 -49% +110% 985 $221   $31,262,564 75
Jan 20, 2016 13 $182,478 -16% +71% 985 $185   $31,445,042 76
Jan 21, 2016 13 $184,303 +1% +44% 985 $187   $31,629,345 77
Jan 22, 2016 15 $370,025 +101% -17% 1,030 $359   $31,999,370 78
Jan 23, 2016 15 $610,541 +65% -9% 1,030 $593   $32,609,911 79
Jan 24, 2016 - $293,060 -52% -45% 1,030 $285   $32,902,971 80
Jan 25, 2016 14 $133,877 -54% -68% 1,030 $130   $33,036,848 81
Jan 26, 2016 14 $186,089 +39% -14% 1,030 $181   $33,222,937 82
Jan 27, 2016 12 $174,924 -6% -4% 1,030 $170   $33,397,861 83
Jan 28, 2016 12 $167,927 -4% -9% 1,030 $163   $33,565,788 84
Jan 29, 2016 14 $280,641 +67% -24% 715 $393   $33,846,429 85
Jan 30, 2016 14 $524,799 +87% -14% 715 $734   $34,371,228 86
Jan 31, 2016 14 $394,599 -25% +35% 715 $552   $34,765,827 87
Feb 1, 2016 14 $118,379 -70% -12% 715 $166   $34,884,206 88
Feb 2, 2016 14 $144,422 +22% -22% 715 $202   $35,028,628 89
Feb 3, 2016 14 $121,315 -16% -31% 715 $170   $35,149,943 90
Feb 4, 2016 14 $118,891 -2% -29% 715 $166   $35,268,834 91
Feb 5, 2016 - $229,797 +93% -18% 668 $344   $35,498,631 92
Feb 6, 2016 - $438,912 +91% -16% 668 $657   $35,937,543 93
Feb 7, 2016 - $166,805 -62% -58% 668 $250   $36,104,348 94
Feb 8, 2016 - $93,410 -44% -21% 668 $140   $36,197,758 95
Feb 9, 2016 - $117,697 +26% -19% 668 $176   $36,315,455 96
Feb 10, 2016 - $102,396 -13% -16% 668 $153   $36,417,851 97
Feb 11, 2016 - $88,061 -14% -26% 668 $132   $36,505,912 98
Feb 12, 2016 - $147,333 +67% -36% 455 $324   $36,653,245 99
Feb 13, 2016 - $287,301 +95% -35% 455 $631   $36,940,546 100
Feb 14, 2016 - $264,317 -8% +58% 455 $581   $37,204,863 101
Feb 15, 2016 - $153,304 -42% +64% 455 $337   $37,358,167 102
Feb 16, 2016 - $78,185 -49% -34% 455 $172   $37,436,352 103
Feb 17, 2016 - $71,148 -9% -31% 455 $156   $37,507,500 104
Feb 18, 2016 - $72,571 +2% -18% 455 $159   $37,580,071 105
Feb 19, 2016 - $122,641 +69% -17% 401 $306   $37,702,712 106
Feb 20, 2016 - $237,924 +94% -17% 401 $593   $37,940,636 107
Feb 21, 2016 - $161,788 -32% -39% 401 $403   $38,102,424 108
Feb 22, 2016 - $59,603 -63% -61% 401 $149   $38,162,027 109
Feb 23, 2016 - $74,503 +25% -5% 401 $186   $38,236,530 110
Feb 24, 2016 - $73,758 -1% +4% 401 $184   $38,310,288 111
Feb 25, 2016 - $75,233 +2% +4% 401 $188   $38,385,521 112
Feb 26, 2016 - $192,781 +156% +57% 685 $281   $38,578,302 113
Feb 27, 2016 - $372,067 +93% +56% 685 $543   $38,950,369 114
Feb 28, 2016 - $171,151 -54% +6% 685 $250   $39,121,520 115
Feb 29, 2016 12 $167,729 -2% +181% 685 $245   $39,289,249 116
Mar 1, 2016 13 $189,534 +13% +154% 685 $277   $39,478,783 117
Mar 2, 2016 12 $174,371 -8% +136% 685 $255   $39,653,154 118
Mar 3, 2016 12 $142,985 -18% +90% 685 $209   $39,796,139 119
Mar 4, 2016 13 $477,303 +234% +148% 1,227 $389   $40,273,442 120
Mar 5, 2016 14 $820,961 +72% +121% 1,227 $669   $41,094,403 121
Mar 6, 2016 14 $467,948 -43% +173% 1,227 $381   $41,562,351 122
Mar 7, 2016 13 $172,461 -63% +3% 1,227 $141   $41,734,812 123
Mar 8, 2016 13 $210,402 +22% +11% 1,227 $171   $41,945,214 124
Mar 9, 2016 13 $162,010 -23% -7% 1,227 $132   $42,107,224 125
Mar 10, 2016 14 $149,050 -8% +4% 1,227 $121   $42,256,274 126
Mar 11, 2016 - $248,330 +67% -48% 847 $293   $42,504,604 127
Mar 12, 2016 15 $429,611 +73% -48% 847 $507   $42,934,215 128
Mar 13, 2016 - $253,471 -41% -46% 847 $299   $43,187,686 129
Mar 14, 2016 - $100,319 -60% -42% 847 $118   $43,288,005 130
Mar 15, 2016 - $122,389 +22% -42% 847 $144   $43,410,394 131
Mar 16, 2016 - $91,792 -25% -43% 847 $108   $43,502,186 132
Mar 17, 2016 - $74,352 -19% -50% 847 $88   $43,576,538 133
Mar 18, 2016 - $106,040 +43% -57% 443 $239   $43,682,578 134
Mar 19, 2016 - $200,415 +89% -53% 443 $452   $43,882,993 135
Mar 20, 2016 - $117,010 -42% -54% 443 $264   $44,000,003 136
Mar 21, 2016 - $49,144 -58% -51% 443 $111   $44,049,147 137
Mar 22, 2016 - $51,601 +5% -58% 443 $116   $44,100,748 138
Mar 23, 2016 - $42,829 -17% -53% 443 $97   $44,143,577 139
Mar 24, 2016 - $37,261 -13% -50% 443 $84   $44,180,838 140
Mar 25, 2016 - $51,706 +39% -51% 206 $251   $44,232,544 141
Mar 26, 2016 - $65,667 +27% -67% 206 $319   $44,298,211 142
Mar 27, 2016 - $40,714 -38% -65% 206 $198   $44,338,925 143
Mar 28, 2016 - $22,393 -45% -54% 206 $109   $44,361,318 144
Mar 29, 2016 - $22,169 -1% -57% 206 $108   $44,383,487 145
Mar 30, 2016 - $18,400 -17% -57% 206 $89   $44,401,887 146
Mar 31, 2016 - $18,768 +2% -50% 206 $91   $44,420,655 147
Apr 1, 2016 - $44,188 +135% -15% 202 $219   $44,464,843 148
Apr 2, 2016 - $68,491 +55% +4% 202 $339   $44,533,334 149
Apr 3, 2016 - $38,355 -44% -6% 202 $190   $44,571,689 150
Apr 4, 2016 - $16,109 -58% -28% 202 $80   $44,587,798 151
Apr 5, 2016 - $23,358 +45% +5% 202 $116   $44,611,156 152
Apr 6, 2016 - $18,219 -22% -1% 202 $90   $44,629,375 153
Apr 7, 2016 - $18,037 -1% -4% 202 $89   $44,647,412 154
Apr 8, 2016 - $22,400 +24% -49% 112 $200   $44,669,812 155
Apr 9, 2016 - $38,304 +71% -44% 112 $342   $44,708,116 156
Apr 10, 2016 - $18,769 -51% -51% 112 $168   $44,726,885 157
Apr 11, 2016 - $8,070 -57% -50% 112 $72   $44,734,955 158
Apr 12, 2016 - $10,814 +34% -54% 112 $97   $44,745,769 159
Apr 13, 2016 - $7,462 -31% -59% 112 $67   $44,753,231 160
Apr 14, 2016 - $10,001 +34% -45% 112 $89   $44,763,232 161
Apr 15, 2016 - $14,211 +42% -37% 103 $138   $44,777,443 162
Apr 16, 2016 - $18,474 +30% -52% 103 $179   $44,795,917 163
Apr 17, 2016 - $12,562 -32% -33% 103 $122   $44,808,479 164
Apr 18, 2016 - $5,527 -56% -32% 103 $54   $44,814,006 165
Apr 19, 2016 - $8,070 +46% -25% 103 $78   $44,822,076 166
Apr 20, 2016 - $6,940 -14% -7% 103 $67   $44,829,016 167
Apr 21, 2016 - $7,634 +10% -24% 103 $74   $44,836,650 168
Apr 22, 2016 - $9,464 +24% -33% 91 $104   $44,846,114 169
Apr 23, 2016 - $15,237 +61% -18% 91 $167   $44,861,351 170
Apr 24, 2016 - $6,552 -57% -48% 91 $72   $44,867,903 171
Apr 25, 2016 - $3,538 -46% -36% 91 $39   $44,871,441 172
Apr 26, 2016 - $7,925 +124% -2% 91 $87   $44,879,366 173
Apr 27, 2016 - $5,865 -26% -15% 91 $64   $44,885,231 174
Apr 28, 2016 - $7,273 +24% -5% 91 $80   $44,892,504 175
Apr 29, 2016 - $22,575 +210% +139% 224 $101   $44,915,079 176
Apr 30, 2016 - $39,729 +76% +161% 224 $177   $44,954,808 177
May 1, 2016 - $33,372 -16% +409% 224 $149   $44,988,180 178
May 2, 2016 - $15,685 -53% +343% 224 $70   $45,003,865 179
May 3, 2016 - $17,881 +14% +126% 224 $80   $45,021,746 180
May 4, 2016 - $18,596 +4% +217% 224 $83   $45,040,342 181
May 5, 2016 - $15,434 -17% +112% 224 $69   $45,055,776 182

Weekly Box Office Performance

DateRankGross% ChangeTheatersPer TheaterTotal GrossWeek
Nov 6, 2015 23 $446,770   5 $89,354   $446,770 1
Nov 13, 2015 11 $1,829,341 +309% 60 $30,489   $2,276,111 2
Nov 20, 2015 10 $5,575,778 +205% 897 $6,216   $7,851,889 3
Nov 27, 2015 7 $5,853,808 +5% 897 $6,526   $13,705,697 4
Dec 4, 2015 8 $4,088,252 -30% 980 $4,172   $17,793,949 5
Dec 11, 2015 8 $3,584,077 -12% 1,089 $3,291   $21,378,026 6
Dec 18, 2015 13 $2,437,057 -32% 825 $2,954   $23,815,083 7
Dec 25, 2015 16 $2,108,796 -13% 480 $4,393   $25,923,879 8
Jan 1, 2016 16 $1,694,127 -20% 385 $4,400   $27,618,006 9
Jan 8, 2016 17 $1,355,157 -20% 368 $3,682   $28,973,163 10
Jan 15, 2016 14 $2,656,182 +96% 985 $2,697   $31,629,345 11
Jan 22, 2016 16 $1,936,443 -27% 1,030 $1,880   $33,565,788 12
Jan 29, 2016 15 $1,703,046 -12% 715 $2,382   $35,268,834 13
Feb 5, 2016 17 $1,237,078 -27% 668 $1,852   $36,505,912 14
Feb 12, 2016 20 $1,074,159 -13% 455 $2,361   $37,580,071 15
Feb 19, 2016 23 $805,450 -25% 401 $2,009   $38,385,521 16
Feb 26, 2016 16 $1,410,618 +75% 685 $2,059   $39,796,139 17
Mar 4, 2016 14 $2,460,135 +74% 1,227 $2,005   $42,256,274 18
Mar 11, 2016 18 $1,320,264 -46% 847 $1,559   $43,576,538 19
Mar 18, 2016 21 $604,300 -54% 443 $1,364   $44,180,838 20
Mar 25, 2016 25 $239,817 -60% 206 $1,164   $44,420,655 21
Apr 1, 2016 27 $226,757 -5% 202 $1,123   $44,647,412 22
Apr 8, 2016 35 $115,820 -49% 112 $1,034   $44,763,232 23
Apr 15, 2016 37 $73,418 -37% 103 $713   $44,836,650 24
Apr 22, 2016 39 $55,854 -24% 91 $614   $44,892,504 25
Apr 29, 2016 32 $163,272 +192% 224 $729   $45,055,776 26

Box Office Summary Per Territory

Territory Release
Date
Opening
Weekend
Opening
Weekend
Screens
Maximum
Screens
Theatrical
Engagements
Total
Box Office
Report
Date
Argentina 2/11/2016 $107,377 40 93 284 $603,774 5/6/2016
Australia 1/15/2016 $38,039 2 176 1,412 $4,057,743 6/9/2016
Austria 2/26/2016 $84,696 40 47 254 $601,753 6/9/2016
Belgium 2/3/2016 $95,581 28 53 236 $559,946 6/9/2016
Bolivia 2/4/2016 $7,462 7 7 22 $37,755 12/31/2018
Brazil 1/7/2016 $229,033 55 141 761 $1,940,004 6/9/2016
Bulgaria 2/19/2016 $9,689 28 28 103 $52,620 2/26/2019
Cambodia 4/8/2016 $1,151 18 18 18 $1,151 12/31/2018
Central America 1/7/2016 $41,801 32 32 50 $109,526 4/12/2016
Chile 2/11/2016 $34,001 13 20 100 $266,011 12/31/2018
Colombia 1/7/2016 $43,080 26 35 164 $241,208 12/31/2018
Croatia 2/18/2016 $19,717 28 28 98 $78,481 12/31/2018
Czech Republic 4/7/2016 $30,689 57 57 150 $82,951 12/31/2018
Denmark 2/25/2016 $82,144 61 61 229 $561,895 6/9/2016
Dominican Republic 1/14/2016 $7,688 4 4 6 $48,239 12/31/2018
Ecuador 1/15/2016 $27,179 24 24 88 $88,101 12/31/2018
Estonia 2/19/2016 $11,214 9 9 9 $11,214 6/9/2016
Finland 1/29/2016 $36,666 28 28 190 $329,234 6/9/2016
France 1/27/2016 $1,143,193 208 209 724 $3,121,913 6/9/2016
Germany 2/25/2016 $355,893 131 176 1,054 $3,026,187 6/9/2016
Greece 2/25/2016 $102,409 37 54 164 $521,154 6/9/2016
Hong Kong 2/18/2016 $98,980 21 21 72 $585,245 6/9/2016
Hungary 2/18/2016 $41,524 22 22 127 $255,701 12/31/2018
Iceland 1/29/2016 $7,172 5 5 26 $43,526 12/31/2018
India 2/19/2016 $86,012 77 77 283 $332,915 6/9/2016
Israel 1/21/2016 $53,218 16 16 167 $432,711 12/31/2018
Italy 2/18/2016 $760,225 184 328 1,228 $4,482,985 6/9/2016
Japan 4/15/2016 $624,874 110 110 110 $1,879,216 8/20/2018
Lithuania 2/19/2016 $0 0 29 52 $41,033 8/9/2016
Mexico 1/15/2016 $128,837 63 136 741 $1,314,401 6/9/2016
Netherlands 1/28/2016 $104,224 42 50 409 $995,903 11/18/2018
New Zealand 1/29/2016 $66,698 45 65 513 $544,998 6/9/2016
Norway 3/11/2016 $51,473 32 32 115 $313,431 6/9/2016
Peru 2/4/2016 $27,145 17 23 67 $192,420 12/31/2018
Philippines 2/10/2016 $8,581 20 20 20 $8,581 12/31/2018
Poland 2/5/2016 $99,891 70 72 366 $567,974 12/31/2018
Portugal 1/28/2016 $120,108 38 43 251 $579,330 6/9/2016
Romania 2/26/2016 $30,232 30 30 104 $133,905 12/31/2018
Russia (CIS) 2/12/2016 $48,212 0 0 0 $155,767 11/13/2018
Serbia and Montenegro 3/3/2016 $9,329 16 18 57 $47,526 12/31/2018
Singapore 1/21/2016 $85,854 17 23 71 $266,021 6/9/2016
Slovakia 4/7/2016 $23,634 59 59 115 $48,906 6/9/2016
Slovenia 2/18/2016 $4,086 5 5 28 $32,344 6/9/2016
South Korea 2/24/2016 $13,850 0 320 937 $1,945,435 3/24/2020
Spain 1/29/2016 $729,005 219 284 1,854 $4,492,604 11/17/2018
Sweden 2/12/2016 $44,590 27 47 211 $501,534 6/9/2016
Thailand 1/14/2016 $63,309 56 56 122 $183,997 6/9/2016
Turkey 1/29/2016 $38,855 16 24 111 $272,951 12/31/2018
United Kingdom 1/29/2016 $1,504,163 241 407 2,531 $8,955,708 6/9/2016
Uruguay 1/28/2016 $18,209 6 14 72 $148,259 12/31/2018
Venezuela 2/19/2016 $7,904 18 18 40 $34,446 6/9/2016
 
Rest of World $716,029
 
International Total$46,846,662 3/24/2020

International Cumulative Box Office Records


Worldwide Cumulative Box Office Records


Weekly US DVD Sales

DateRankUnits
this
Week
% ChangeTotal
Units
Spending
this
Week
Total
Spending
Weeks
in
Release
Feb 28, 2016742,250 42,250$717,828$717,8284
Mar 6, 20161022,178-48% 64,428$376,804$1,094,6325
Mar 13, 20162614,941-33% 79,369$253,848$1,348,4806

Weekly US Blu-ray Sales

DateRankUnits
this
Week
% ChangeTotal
Units
Spending
this
Week
Total
Spending
Weeks
in
Release
Feb 28, 2016336,651 36,651$732,645$732,6454
Mar 6, 2016436,421-1% 73,072$728,049$1,460,6945
Mar 13, 20161412,127-67% 85,199$241,932$1,702,6266

Our DVD and Blu-ray sales estimates are based on weekly retail surveys, which we use to build a weekly market share estimate for each title we are tracking. The market share is converted into a weekly sales estimate based on industry reports on the overall size of the market, including reports published in Media Play News.

For example, if our weekly retail survey estimates that a particular title sold 1% of all units that week, and the industry reports sales of 1,500,000 units in total, we will estimate 15,000 units were sold of that title. The consumer spending estimate is based on the average sales price for the title in the retailers we survey.

We refine our estimates from week to week as more data becomes available. In particular, we adjust weekly sales figures for the quarter once the total market estimates are published by the Digital Entertainment Group. Figures will therefore fluctuate each week, and totals for individual titles can go up or down as we update our estimates.

Because sales figures are estimated based on sampling, they will be more accurate for higher-selling titles.

Full financial estimates for this film, including domestic and international box office, video sales, video rentals, TV and ancillary revenue are available through our research services. For more information, please contact us at research@the-numbers.com.

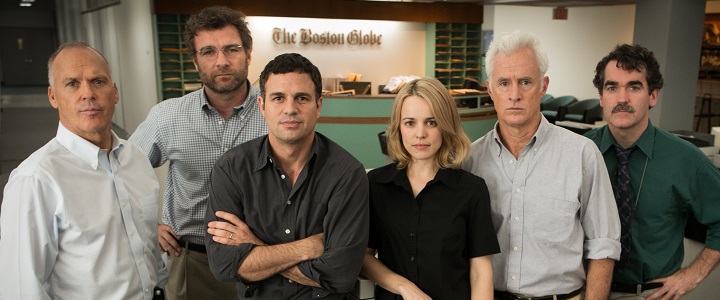
Lead Ensemble Members

Mark Ruffalo Michael Rezendes
Michael Keaton Walter 'Robby' Robinson
Rachel McAdams Sacha Pfeiffer
Liev Schreiber Marty Baron
Stanley Tucci Mitchell Garabedian

Supporting Cast

John Slattery Ben Bradlee Jr.
Brian d'Arcy James Matty Carroll
Billy Crudup Eric MacLeish
Jamey Sheridan Jim Sullivan
Len Cariou Cardinal Law
Lance Norris Driver

For a description of the different acting role types we use to categorize acting perfomances, see our Glossary.

Production and Technical Credits

Tom McCarthy Director
Josh Singer Screenwriter
Tom McCarthy Screenwriter
Steve Golin Producer
Michael Sugar Producer
Nicole Rocklin Producer
Blye Pagon Faust* Producer
Jeff Skoll Executive Producer
Jonathan King Executive Producer
Pierre Omidyar Executive Producer
Michael Bederman Executive Producer
Bard Dorros Executive Producer
Tom Ortenberg Executive Producer
Peter Lawson Executive Producer
Xavier Marchand Executive Producer
Masanobu Takayanagi Director of Photography
Stephen Carter Production Designer
Tom McArdle Editor
Wendy Chuck Costume Designer
Howard Shore Composer
Kerry Barden Casting Director
Paul Schnee Casting Director

Oscar Predictions: Mad Max Heads Technical Categories, Revenant Favorite for Best Picture

February 28th, 2016

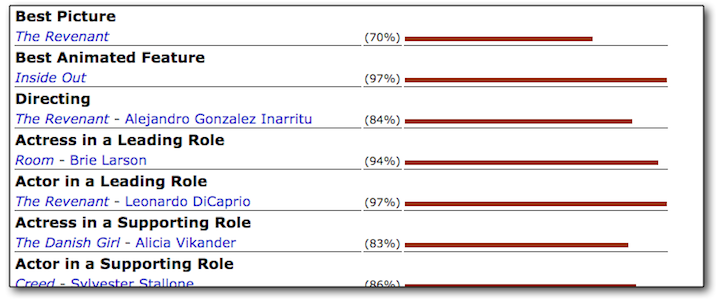
Voting in our annual Predict the Academy Awards contest is now closed, and we can reveal the final vote totals in each category, along with the rough probability for which film will win each award. This is a year where readers are very confident about the outcomes in many of the categories. In fact, there isn’t a single major category where less than 50% of readers picked the same winner, and there are five Oscars where 90% or more of readers agreed on the outcome, including a massive 97% of the vote for Inside Out for Best Animated Feature. That makes The Revenant a rather more uncertain bet, with 70% of readers favoring it for Best Picture. That’s actually theoretically the closest call among all the major prizes… More...

2015 Awards Season: Oscar Preview

February 28th, 2016

The Revenant

It’s Oscar day and, if all goes to plan, I will be live-blogging the ceremony tonight. Here is the list of nominees marked according to predictions from our readers, and my personal wishes. Nominees in Bold are the ones predicted to win by our readers (we’ll have a full rundown of the predictions at noon, after the contest ends). If I am predicting a different film, those are in Italics. Meanwhile, the nominees I want to win, but don’t think will win, are Underlined. There are a few categories where the film I really think deserves the award was not even nominated, plus a few I don’t have a real opinion on.

If you haven’t done so already, it’s not too late to enter our Oscar competition, and win all Best Picture nominees on Blu-ray or DVD. More...

2015 Awards Season: Oscar Highlight: Best Picture

February 27th, 2016

The Revenant

With our annual Oscar Prediction contest closing at noon tomorrow, now is the best time to look at the nominees and try to figure out who the favorites are and which films should just feel honored to be nominated. This morning, we get to the final category, Best Picture. The film I think should win, Inside Out, wasn't even nominated. Of the movies on this list, I think The Martian is the best. If you look at the odds makers, it isn’t even in the top three. I’m going to be doubly disappointed tomorrow. More...

2015 Awards Season: Oscar Highlight: Best Supporting Actor

February 24th, 2016

Creed

With our annual Oscar Prediction contest underway, now is the best time to look at the nominees and try and figure out who the favorites are and which films should just feel honored to be nominated. Like the Best Supporting Actress, Best Supporting Actor is a two-horse race, making it one of the more competitive categories of the ones we are going to look at. More...

2015 Awards Season: Oscar Highlight: Best Supporting Actress

February 24th, 2016

The Danish Girl

With our annual Oscar Prediction contest underway, now is the best time to look at the nominees and try and figure out who the favorites are and which films should just feel honored to be nominated. This year, Best Supporting Actress is a two-horse race, making it one of the more competitive categories of the ones we are going to look at. More...

Home Market Releases for February 23rd, 2016

February 23rd, 2016

The Big Sleep

It's not a great week on the home market. The Good Dinosaur is the biggest release this week, but it is the only wide release of note. Spotlight started out in limited release, but while it expanded significantly, it never expanded truly wide. As for the Pick of the Week, I'm going with the Bogart / Bacall Blu-ray Double-Shot: The Big Sleep and Key Largo.

On a side note, it is another short list this week, because Amazon continues to be run by morons. I tried to get help from chat, but that wasn't very successful. I "talked" to four people without getting an answer. Two of which logged in and then logged out without saying a thing. One logged in, introduced themselves, then logged out when I asked a question. I tried through e-mail, but a week later and no reply. I have a phone number for press and I will try that once the Oscars are over and I'm not overwhelmed with work. More...

2015 Awards Season: Oscar Highlight: Best Original Screenplay

February 20th, 2016

Spotlight

With our annual Oscar Prediction contest underway, now is the best time to look at the nominees and try and figure out who the favorites are and which films should just feel honored to be nominated. The Best Original Screenplay category isn't the most lop-sided category we will highlight, but it is also not very competitive. More...

2015 - Awards Season: BAFTA - Winners - Revenant and Mad Max Lead the Way

February 15th, 2016

The Revenant

The BAFTA awards were handed out over the weekend. There were two main winners, The Revenant, which won most of its five awards in the high-prestige categories, and Mad Max: Fury Road, which earn all four of its awards in technical categories. It appears the Oscars will be very similar in that breakdown. More...

Home Market Releases for February 2nd, 2016

February 2nd, 2016

Snow White and the Seven Dwarfs

This week the home market is led by a Blu-ray double-dip, Snow White and the Seven Dwarfs, while there is also an Oscar contender, Bridge of Spies, on the top. After that, the list is filled with bombs and weaker limited releases. It was an easy choice to select Snow White as Pick of the Week. More...

2015 Awards Season: SAG Winners—Oscar Picture Clarifies, Mostly

January 31st, 2016

Spotlight

The Screen Actors Guild winners were handed out last night and for the most part the winners here will likely walk away with an Oscar. There is one major exception. More...

2015 Awards Season: The Big Short’s Surprise PGA Win Shakes Up Oscar Race

January 24th, 2016

The Big Short

The Producers Guild of America handed out their awards last night and The Big Short came out the surprise winner for the top prize. That victory shakes up an awards season that had looked like it would be a two-horse race between Spotlight and The Revenant. More...

Theater Averages: The Lady in the Van tops Yearly Chart with $18,066

January 20th, 2016

The Lady in the Van

I know it is early in the year, but The Lady in the Van has set the record for best opening theater average for 2016 at $18,066. That record likely won't last very long, but it is good for this time of year. The only other film in the $10,000 club was the overall number one film, Ride Along 2, which earned an average of $11,100. More...

2015 Awards Season: Oscars - Nominations

January 15th, 2016

The Revenant

The Oscar nominations were announced at 5:30 am Pacific time. Nothing is good that early in the morning. Worse still, this was a terrible year for snubs, especially when it comes to diversity of the nominees. The voters for the Oscars are 94% white and 77% male... but that's still more diverse than the list of nominees. The Revenant led the way with 12 nominations and it is expected to win a few of those, while it is a serious contender in most of the categories it was nominated in. More...

2015 - Awards Season: DGA - Nominations

January 14th, 2016

Mad Max: Fury Road

The Directors Guild of America spread out the nominations, which I always felt hurt the buzz. There are ten categories of awards, but only three of which pertain to theatrical releases. There are very few surprises across these three categories, so the Oscar nominations today shouldn't be full of surprises either. More...

2015 - Awards Season: Golden Globes - Winners

January 11th, 2016

The Revenant

The Golden Globes were handed out on Sunday evening. There were a few minor surprises and some infuriating results. On the other hand, no one film truly dominated, with The Revenant leading the way with just three wins. Only two other movies earned more than one win, The Martian and Steve Jobs. More...

2015 - Awards Season: BAFTA - Nominations

January 9th, 2016

Bridge of Spies

The BAFTA nominations were announced and you can read them on their site... in alphabetical order. Alphabetical order is very useful in most circumstances, but not here. On the other hand, the nominees within each category are not presented in alphabetical order. ... Are the BAFTAs trolling us? As for the actual nominees, the big winners here are Bridge of Spies and Carol, both of which earned nine nominations. For Carol, this is just another impressive score, but this was a pleasant surprise for Bridge of Spies. More...

2015 - Awards Season: WGA - Nominations

January 6th, 2016

Spotlight

The Writers Guild of America nominees were announced and there are only a few surprises here. Additionally, one of these three races seems too close to call at this point. More...

Theater Averages: Revenant Remains Potent with Average of $111,957

January 5th, 2016

The Revenant

The Revenant remained on top of the theater average chart dipping just 6% to an average of $111,957 in four theaters. That's amazing and it bodes very well for its chances during its wide expansion this weekend. Furthermore, there are some major Awards Season events this week that could boost ticket sales even more. Anomalisa was well back in second place, but it still had an impressive opening with an average of $33,806 over the weekend and an average of $52,658 during its five-day opening. Star Wars: The Force Awakens was next with an average of $21,829. Chimes at Midnight earned $20,480 in one theater during its re-release, while Only Yesterday earned $14,970, also in one theater. The latter film is yet another success for GKIDS; this is the only studio that routinely has success with animated films in limited release. 45 Years remained in the $10,000 club with an average of $14,588 in six theaters. It doubled its theater count, but the average only fell 33% and that's a great sign for further expansion. Mr. Six is the fourth holdover in the $10,000 club earning an average of $10,406 in 28 theaters. More...

Per Theater Chart: The Big Short was Nearly the Biggest

December 15th, 2015

The Big Short

We have a new champion on top of the per theater chart this week, as The Big Short earned one of the best limited release openings of the year. Its average of $88,191 was behind only Steve Jobs for the year and Steve Jobs opened in half as many theaters as The Big Short, 8 to 4. Carol remained strong in second place with an average of $21,105 in 16 theaters. Thankfully it is expanding, but I'm worried the studio waited too long and it won't reach its potential. Yellow Day opened with an average of $13,130 in two theaters. The Danish Girl rounded out the $10,000 club with an average of $10,964 in 24 theaters. By this time next week, it could be over $1 million in total. More...

2015 - Awards Season: Golden Globes - Nominations

December 10th, 2015

Carol

The Golden Globes nominations were announced this morning and we are already beginning to see a trend for this year's Awards Season. For the most part, the same films are coming up over and over again. Carol led the way with five awards, while there was a three-way tie for second place with The Big Short, The Revenant and Steve Jobs each picking up four. More...

2015 Awards Season: SAG Nominations

December 9th, 2015

Trumbo

The Screen Actors Guild nominations were announced today and there are at least a few surprises to talk about. Trumbo led the way with three nominations, but there were six films with two nods apiece. Six!

More...

Per Theater Chart: Carol Completes the Hat-trick

December 8th, 2015

Carol

For the third weekend in a row, Carol earned first place on the per theater chart, this time with an average of $36,281. It is still playing in only four theaters, which is a huge mistake in my mind. It really should have expanded by now. The Danish Girl remained in second place with an average of $26,089, also in four theaters. It too should expand. The best new release was Youth, which opened with an average of $19,521, again in four theaters. Macbeth was playing in five theaters and earned an average of $13,967. Hitchcock/Truffaut opened with an average of $9,393 in three theaters over the weekend, but it was a Wednesday release. Its five-day average was $11,927. More...

Per Theater Chart: Carol's Second Verse is the Same as the First

December 1st, 2015

Carol

Carol remained in first place on the per theater chart with an average of $49,443 in four theaters. This is 22% lower than the film's opening weekend average, which isn't bad for a limited release. The Danish Girl opened in a close second place with $46,830, also in four theaters. The Hunger Games: Mockingjay - Part 2 earned first place on the overall chart and third place on the per theater chart with an average of $12,456. Janis: Little Girl Blue earned an average of $10,931 in two theaters, which is great for a documentary. The second wide release in the $10,000 club was The Good Dinosaur with an average of $10,444. More...

2015 - Awards Season: Independent Spirit Awards - Nominations

November 25th, 2015

Carol

Awards Season begins with the Independent Spirit Awards nominations. There were definitely some surprise nominees this year, but that also meant there were some unfortunate snubs as well. The overall leader was Carol, which just opened this past weekend. This is great timing and should help its box office numbers, as well as its chances throughout Awards Season. Its six nominations were one ahead of Beasts of No Nation and Spotlight. (One of Spotlight's was the Robert Altman Award, which has no nominations, just one winner.)

More...

Per Theater Chart: Carol Sings a Joyful Tune

November 24th, 2015

Carol

Carol had a festive opening earning just over $250,000 in four theaters for an average of $63,378. That's the third best average for an opening this year, just ahead of Ex Machina and just behind Sicario. The overall box office leader, The Hunger Games: Mockingjay - Part 2, was next with an average of $24,591. Legend was next with an average of $21,709 in four theaters. That's a good start, but its reviews suggest not so good legs. Speaking of long legs, Brooklyn remained in the $10,000 for the third week in a row earning an average of $10,270 in just over 100 theaters. More...

Weekend Wrap-Up: Moviegoers Satisfied with Final Course of Hunger Games

November 24th, 2015

The Hunger Games: Mockingjay, Part 2

The Curse of the High Expectations strikes again. The Hunger Games: Mockingjay, Part 2 became the fifth film of the year to open with more than $100 million. This should be a reason to celebrate, but it marks a very steep decline from previous films in the Hunger Games franchise. The other two wide releases, The Night Before and Secret in Their Eyes, both failed to meet expectations, leaving the overall box office softer than anticipated. Granted, it still grew 60% from last weekend to $173 million, but this is 10% lower than the same weekend last year. Year-to-date, 2015 is still ahead of 2014 by a comfortable margin of 3.6% or $320 million. It would take a sizable collapse for 2015 to not come out on top in terms of raw box office dollars. On the other hand, it wouldn't take too much for it to slip below ticket price inflation, which is about 2% this year. More...

Weekend Estimates: Mockingjay Tops $100 Million, But Only Just

November 22nd, 2015

Mockingjay Part 2

The Hunger Games: Mockingjay—Part 2 is about to record the most disappointing $100 million weekend ever, based on Sunday’s estimate from Lionsgate. Why disappointing? Because its $101.025 million projected opening follows the $158 million earned by Catching Fire on this weekend in 2013 (then the sixth-biggest weekend ever), and the $122 million debut of Mockingjay—Part 1 this weekend last year. That marks a decline of 20% or so from one installment of the franchise to the next, which is the worst performance of any franchise to have recorded a $100 million start. Global numbers tell a similar story: $247 million this weekend against Part 1’s $275 million. However, once we get that troubling statistic out the way, this is also a reason for celebration: $100 million domestically and $250 million globally in one weekend is still a huge amount of money, and caps a spectacularly successful franchise for Lionsgate. More...

Per Theater Chart: James Can't Take the Spotlight

November 17th, 2015

James White

There was only one new release in the $10,000 club and it had to settle for third place on the per theater chart. This left Spotlight in first place with an average of $22,561 in 60 theaters. This is a great result for a film expanding from five to 60 theaters. Brooklyn also expanded, going from five theaters to 23 theaters, while its per theater average remained strong with an average of $20,868. James White was the only new release in the $10,000 club debuting with $12,007 in its lone theater. More...

Weekend Estimates: Spectre Set to Be Number Two Bond

November 15th, 2015

Spectre

Sony are predicting a decline of just 50% for Spectre in its second weekend in theaters, putting James Bond’s latest incarnation on track for a final domestic box office in the neighborhood of $200 million. While well short of Skyfall’s $304 million, it welcome news for a film that’s probably right on the bubble as far as profitability is concerned. More...

Friday Estimates: Openers Fall Well Short of Spectre and Peanuts

November 14th, 2015

Spectre

Three new wide releases are all, as expected, struggling to make much headway against Spectre and The Peanuts Movie this weekend, with the two returning films sitting comfortably at the top of the chart. Spectre picked up an estimated $10.2 million on Friday for a total to date of $105.5 million, while Peanuts earned another $5.6 million, for $63.9 million so far. More...

Per Theater Chart: Spotlight Shines Bright

November 10th, 2015

Spotlight

It was a busy week on the per theater chart with seven films in the $10,000 club. Spotlight led the way with an average of $59,002 in five theaters. This is the fourth best opening weekend average of 2015, just ahead of While We're Young and just behind Ex Machina. Brooklyn was next with an average of $37,456, also in five theaters. It opened on Wednesday, so its weekend average was a little lower than it otherwise would have been. The overall number one film, Spectre, was third with an average of $17,919. In Jackson Heights was on the opposite end of the scale playing in just one theater. It did well with an opening of $15,150. Trumbo was very close behind with an average of $14,835 in five theaters. Its reviews suggest it won't expand significantly, but this is a great start. The second wide release of the week was The Peanuts Movie, which opened with an average of $11,345. The final film in the $10,000 club was Peggy Guggenheim - Art Addict, which earned an average of $11,129 in two theaters. More...

Weekend Estimates: Spectre Misses Record, Peanuts Opens Strong

November 8th, 2015

Spectre

After a great night on Thursday and a very good day on Friday, Spectre has faded a bit over the weekend. After posting $28 million on Friday, the film was down about 4% on Saturday to $26.5 million, and Sony is projecting a weekend total of $73 million. Even that number may be a shade high, and it falls well behind the $80 million that looked on the cards earlier in the weekend, and even further behind Skyfall’s franchise-record $88.4 million opening. While by any measure it’s a great debut, the final number does prompt the question: what went wrong over the weekend? More...

Limited and VOD Releases: Shining a Spotlight on Limited Releases

November 6th, 2015

Brooklyn

It is a short list this week, due to technical considerations. However, there are seven films here that are earning good reviews and some measure of pre-release buzz. The film with the best shot at mainstream success is Brooklyn (Reviews). It isn't the only film that could succeed, as Spotlight, Trumbo, and the rest could also find receptive audiences during Awards Season. More...


  1. Summary
  2. News
  3. Box Office
  4. International
  5. Video Sales
  6. Full Financials
  7. Cast & Crew
  8. Trailer

Synopsis

The true story of the Pulitzer Prize-winning Boston Globe investigation that would rock the city and cause a crisis in one of the world’s oldest and most trusted institutions. When the newspaper’s tenacious “Spotlight” team of reporters delve into allegations of abuse in the Catholic Church, their year-long investigation uncovers a decades-long cover-up at the highest levels of Boston’s religious, legal, and government establishment, touching off a wave of revelations around the world.

Metrics

Opening Weekend:$295,009 (0.7% of total gross)
Legs:10.22 (domestic box office/biggest weekend)
Domestic Share:49.0% (domestic box office/worldwide)
Production Budget:$20,000,000 (worldwide box office is 4.6 times production budget)
Theater counts:5 opening theaters/1,227 max. theaters, 11.5 weeks average run per theater
Infl. Adj. Dom. BO $57,032,107

Latest Ranking on Cumulative Box Office Lists


Watch Now On

Amazon VOD:Amazon
iTunes:iTunes
Google Play:Google Play, Google Play
Vudu:Vudu

Movie Details

Domestic Releases: November 6th, 2015 (Limited) by Open Road
International Releases: January 7th, 2016 (Wide) (Brazil)
January 7th, 2016 (Wide) (Central America)
January 7th, 2016 (Wide) (Colombia)
January 14th, 2016 (Wide) (Dominican Republic)
January 14th, 2016 (Wide) (Thailand)
... Show all releases
Video Release: February 2nd, 2016 by Universal Home Entertainment
MPAA Rating: R for some language including sexual references.
(Rating bulletin 2386, 8/12/2015)
Running Time: 128 minutes
Comparisons: Best Picture Oscar Winners
Best Picture Oscar Nominees, 2016
vs. Trumbo
Create your own comparison chart…
Keywords: 2016 Oscars Best Picture Nominee, Oscars Best Picture Winner, Investigative Journalist, Sex Crimes, Child Abuse, Dysfunctional Family, Government Corruption, Docudrama
Source:Based on Real Life Events
Genre:Drama
Production Method:Live Action
Creative Type:Dramatization
Production/Financing Companies: Anonymous Content, Rocklin/Faust, Open Road Films, Participant Media, First Look Media, Topic
Production Countries: United States
Languages: English

Ranking on other Records and Milestones

RecordRankAmountChart
Date
Days In
Release
Biggest 26th Weekend Limited Release 24 $95,676 Apr 29, 2016 178
Biggest 25th Weekend Limited Release 77 $31,253 Apr 22, 2016 171
Biggest 24th Weekend Limited Release 65 $45,247 Apr 15, 2016 164
Biggest 23rd Weekend Limited Release 53 $79,473 Apr 8, 2016 157
Biggest 22nd Weekend Limited Release 43 $151,034 Apr 1, 2016 150
Biggest 21st Weekend Limited Release 51 $158,087 Mar 25, 2016 143
Biggest 20th Weekend Limited Release 26 $423,465 Mar 18, 2016 136
Biggest Domestic 19th Weekend 69 $931,412 Mar 11, 2016 129
Biggest 19th Weekend Limited Release 13 $931,412 Mar 11, 2016 129
Biggest Domestic 18th Weekend 48 $1,766,212 Mar 4, 2016 122
Biggest 18th Weekend Limited Release 9 $1,766,212 Mar 4, 2016 122
Biggest 17th Weekend Limited Release 33 $735,999 Feb 26, 2016 115
Biggest 16th Weekend Limited Release 50 $522,353 Feb 19, 2016 108
Biggest 15th Weekend Limited Release 48 $698,951 Feb 12, 2016 101
Biggest 14th Weekend Limited Release 48 $835,514 Feb 5, 2016 94
Biggest 13th Weekend Limited Release 40 $1,200,039 Jan 29, 2016 87
Biggest 12th Weekend Limited Release 38 $1,273,626 Jan 22, 2016 80
Biggest 11th Weekend Limited Release 35 $1,650,133 Jan 15, 2016 73
Biggest 10th Weekend Limited Release 71 $928,471 Jan 8, 2016 66
Biggest 9th Weekend Limited Release 67 $1,185,093 Jan 1, 2016 59
Biggest 8th Weekend Limited Release 94 $1,083,976 Dec 25, 2015 52
Biggest 7th Weekend Limited Release 83 $1,425,193 Dec 18, 2015 45
Biggest 6th Weekend Limited Release 46 $2,508,853 Dec 11, 2015 38
Biggest 5th Weekend Limited Release 52 $2,800,008 Dec 4, 2015 31
Biggest 4th Weekend Limited Release 24 $4,408,252 Nov 27, 2015 24
Thanksgiving (All Movies, 3-Day, Inflation Adjusted) 353 $5,626,792 Nov 27, 2015 24
Thanksgiving (All Movies, 5-Day) 268 $5,639,121 Nov 27, 2015 24
Thanksgiving (All Movies, 5-Day, Inflation Adjusted) 310 $5,999,342 Nov 27, 2015 24
Biggest 3rd Weekend Limited Release 30 $3,528,384 Nov 20, 2015 17
Top 2015 Theater Average 9 $59,002 Nov 6, 2015 3
Widest Expansion Limited Release 55 1,222 Nov 6, 2015 0

Lead Ensemble Members

Mark Ruffalo Michael Rezendes
Michael Keaton Walter 'Robby' Robinson
Rachel McAdams Sacha Pfeiffer
Liev Schreiber Marty Baron
Stanley Tucci Mitchell Garabedian

Supporting Cast

John Slattery Ben Bradlee Jr.
Brian d'Arcy James Matty Carroll
Billy Crudup Eric MacLeish
Jamey Sheridan Jim Sullivan
Len Cariou Cardinal Law
Lance Norris Driver

For a description of the different acting role types we use to categorize acting perfomances, see our Glossary.

Production and Technical Credits

Tom McCarthy Director
Josh Singer Screenwriter
Tom McCarthy Screenwriter
Steve Golin Producer
Michael Sugar Producer
Nicole Rocklin Producer
Blye Pagon Faust* Producer
Jeff Skoll Executive Producer
Jonathan King Executive Producer
Pierre Omidyar Executive Producer
Michael Bederman Executive Producer
Bard Dorros Executive Producer
Tom Ortenberg Executive Producer
Peter Lawson Executive Producer
Xavier Marchand Executive Producer
Masanobu Takayanagi Director of Photography
Stephen Carter Production Designer
Tom McArdle Editor
Wendy Chuck Costume Designer
Howard Shore Composer
Kerry Barden Casting Director
Paul Schnee Casting Director

Oscar Predictions: Mad Max Heads Technical Categories, Revenant Favorite for Best Picture

February 28th, 2016

Voting in our annual Predict the Academy Awards contest is now closed, and we can reveal the final vote totals in each category, along with the rough probability for which film will win each award. This is a year where readers are very confident about the outcomes in many of the categories. In fact, there isn’t a single major category where less than 50% of readers picked the same winner, and there are five Oscars where 90% or more of readers agreed on the outcome, including a massive 97% of the vote for Inside Out for Best Animated Feature. That makes The Revenant a rather more uncertain bet, with 70% of readers favoring it for Best Picture. That’s actually theoretically the closest call among all the major prizes… More...

2015 Awards Season: Oscar Preview

February 28th, 2016

The Revenant

It’s Oscar day and, if all goes to plan, I will be live-blogging the ceremony tonight. Here is the list of nominees marked according to predictions from our readers, and my personal wishes. Nominees in Bold are the ones predicted to win by our readers (we’ll have a full rundown of the predictions at noon, after the contest ends). If I am predicting a different film, those are in Italics. Meanwhile, the nominees I want to win, but don’t think will win, are Underlined. There are a few categories where the film I really think deserves the award was not even nominated, plus a few I don’t have a real opinion on.

If you haven’t done so already, it’s not too late to enter our Oscar competition, and win all Best Picture nominees on Blu-ray or DVD. More...

2015 Awards Season: Oscar Highlight: Best Picture

February 27th, 2016

The Revenant

With our annual Oscar Prediction contest closing at noon tomorrow, now is the best time to look at the nominees and try to figure out who the favorites are and which films should just feel honored to be nominated. This morning, we get to the final category, Best Picture. The film I think should win, Inside Out, wasn't even nominated. Of the movies on this list, I think The Martian is the best. If you look at the odds makers, it isn’t even in the top three. I’m going to be doubly disappointed tomorrow. More...

2015 Awards Season: Oscar Highlight: Best Supporting Actor

February 24th, 2016

Creed

With our annual Oscar Prediction contest underway, now is the best time to look at the nominees and try and figure out who the favorites are and which films should just feel honored to be nominated. Like the Best Supporting Actress, Best Supporting Actor is a two-horse race, making it one of the more competitive categories of the ones we are going to look at. More...

2015 Awards Season: Oscar Highlight: Best Supporting Actress

February 24th, 2016

The Danish Girl

With our annual Oscar Prediction contest underway, now is the best time to look at the nominees and try and figure out who the favorites are and which films should just feel honored to be nominated. This year, Best Supporting Actress is a two-horse race, making it one of the more competitive categories of the ones we are going to look at. More...

Home Market Releases for February 23rd, 2016

February 23rd, 2016

The Big Sleep

It's not a great week on the home market. The Good Dinosaur is the biggest release this week, but it is the only wide release of note. Spotlight started out in limited release, but while it expanded significantly, it never expanded truly wide. As for the Pick of the Week, I'm going with the Bogart / Bacall Blu-ray Double-Shot: The Big Sleep and Key Largo.

On a side note, it is another short list this week, because Amazon continues to be run by morons. I tried to get help from chat, but that wasn't very successful. I "talked" to four people without getting an answer. Two of which logged in and then logged out without saying a thing. One logged in, introduced themselves, then logged out when I asked a question. I tried through e-mail, but a week later and no reply. I have a phone number for press and I will try that once the Oscars are over and I'm not overwhelmed with work. More...

2015 Awards Season: Oscar Highlight: Best Original Screenplay

February 20th, 2016

Spotlight

With our annual Oscar Prediction contest underway, now is the best time to look at the nominees and try and figure out who the favorites are and which films should just feel honored to be nominated. The Best Original Screenplay category isn't the most lop-sided category we will highlight, but it is also not very competitive. More...

2015 - Awards Season: BAFTA - Winners - Revenant and Mad Max Lead the Way

February 15th, 2016

The Revenant

The BAFTA awards were handed out over the weekend. There were two main winners, The Revenant, which won most of its five awards in the high-prestige categories, and Mad Max: Fury Road, which earn all four of its awards in technical categories. It appears the Oscars will be very similar in that breakdown. More...

Home Market Releases for February 2nd, 2016

February 2nd, 2016

Snow White and the Seven Dwarfs

This week the home market is led by a Blu-ray double-dip, Snow White and the Seven Dwarfs, while there is also an Oscar contender, Bridge of Spies, on the top. After that, the list is filled with bombs and weaker limited releases. It was an easy choice to select Snow White as Pick of the Week. More...

2015 Awards Season: SAG Winners—Oscar Picture Clarifies, Mostly

January 31st, 2016

Spotlight

The Screen Actors Guild winners were handed out last night and for the most part the winners here will likely walk away with an Oscar. There is one major exception. More...

2015 Awards Season: The Big Short’s Surprise PGA Win Shakes Up Oscar Race

January 24th, 2016

The Big Short

The Producers Guild of America handed out their awards last night and The Big Short came out the surprise winner for the top prize. That victory shakes up an awards season that had looked like it would be a two-horse race between Spotlight and The Revenant. More...

Theater Averages: The Lady in the Van tops Yearly Chart with $18,066

January 20th, 2016

The Lady in the Van

I know it is early in the year, but The Lady in the Van has set the record for best opening theater average for 2016 at $18,066. That record likely won't last very long, but it is good for this time of year. The only other film in the $10,000 club was the overall number one film, Ride Along 2, which earned an average of $11,100. More...

2015 Awards Season: Oscars - Nominations

January 15th, 2016

The Revenant

The Oscar nominations were announced at 5:30 am Pacific time. Nothing is good that early in the morning. Worse still, this was a terrible year for snubs, especially when it comes to diversity of the nominees. The voters for the Oscars are 94% white and 77% male... but that's still more diverse than the list of nominees. The Revenant led the way with 12 nominations and it is expected to win a few of those, while it is a serious contender in most of the categories it was nominated in. More...

2015 - Awards Season: DGA - Nominations

January 14th, 2016

Mad Max: Fury Road

The Directors Guild of America spread out the nominations, which I always felt hurt the buzz. There are ten categories of awards, but only three of which pertain to theatrical releases. There are very few surprises across these three categories, so the Oscar nominations today shouldn't be full of surprises either. More...

2015 - Awards Season: Golden Globes - Winners

January 11th, 2016

The Revenant

The Golden Globes were handed out on Sunday evening. There were a few minor surprises and some infuriating results. On the other hand, no one film truly dominated, with The Revenant leading the way with just three wins. Only two other movies earned more than one win, The Martian and Steve Jobs. More...

2015 - Awards Season: BAFTA - Nominations

January 9th, 2016

Bridge of Spies

The BAFTA nominations were announced and you can read them on their site... in alphabetical order. Alphabetical order is very useful in most circumstances, but not here. On the other hand, the nominees within each category are not presented in alphabetical order. ... Are the BAFTAs trolling us? As for the actual nominees, the big winners here are Bridge of Spies and Carol, both of which earned nine nominations. For Carol, this is just another impressive score, but this was a pleasant surprise for Bridge of Spies. More...

2015 - Awards Season: WGA - Nominations

January 6th, 2016

Spotlight

The Writers Guild of America nominees were announced and there are only a few surprises here. Additionally, one of these three races seems too close to call at this point. More...

Theater Averages: Revenant Remains Potent with Average of $111,957

January 5th, 2016

The Revenant

The Revenant remained on top of the theater average chart dipping just 6% to an average of $111,957 in four theaters. That's amazing and it bodes very well for its chances during its wide expansion this weekend. Furthermore, there are some major Awards Season events this week that could boost ticket sales even more. Anomalisa was well back in second place, but it still had an impressive opening with an average of $33,806 over the weekend and an average of $52,658 during its five-day opening. Star Wars: The Force Awakens was next with an average of $21,829. Chimes at Midnight earned $20,480 in one theater during its re-release, while Only Yesterday earned $14,970, also in one theater. The latter film is yet another success for GKIDS; this is the only studio that routinely has success with animated films in limited release. 45 Years remained in the $10,000 club with an average of $14,588 in six theaters. It doubled its theater count, but the average only fell 33% and that's a great sign for further expansion. Mr. Six is the fourth holdover in the $10,000 club earning an average of $10,406 in 28 theaters. More...

Per Theater Chart: The Big Short was Nearly the Biggest

December 15th, 2015

The Big Short

We have a new champion on top of the per theater chart this week, as The Big Short earned one of the best limited release openings of the year. Its average of $88,191 was behind only Steve Jobs for the year and Steve Jobs opened in half as many theaters as The Big Short, 8 to 4. Carol remained strong in second place with an average of $21,105 in 16 theaters. Thankfully it is expanding, but I'm worried the studio waited too long and it won't reach its potential. Yellow Day opened with an average of $13,130 in two theaters. The Danish Girl rounded out the $10,000 club with an average of $10,964 in 24 theaters. By this time next week, it could be over $1 million in total. More...

2015 - Awards Season: Golden Globes - Nominations

December 10th, 2015

Carol

The Golden Globes nominations were announced this morning and we are already beginning to see a trend for this year's Awards Season. For the most part, the same films are coming up over and over again. Carol led the way with five awards, while there was a three-way tie for second place with The Big Short, The Revenant and Steve Jobs each picking up four. More...

2015 Awards Season: SAG Nominations

December 9th, 2015

Trumbo

The Screen Actors Guild nominations were announced today and there are at least a few surprises to talk about. Trumbo led the way with three nominations, but there were six films with two nods apiece. Six!

More...

Per Theater Chart: Carol Completes the Hat-trick

December 8th, 2015

Carol

For the third weekend in a row, Carol earned first place on the per theater chart, this time with an average of $36,281. It is still playing in only four theaters, which is a huge mistake in my mind. It really should have expanded by now. The Danish Girl remained in second place with an average of $26,089, also in four theaters. It too should expand. The best new release was Youth, which opened with an average of $19,521, again in four theaters. Macbeth was playing in five theaters and earned an average of $13,967. Hitchcock/Truffaut opened with an average of $9,393 in three theaters over the weekend, but it was a Wednesday release. Its five-day average was $11,927. More...

Per Theater Chart: Carol's Second Verse is the Same as the First

December 1st, 2015

Carol

Carol remained in first place on the per theater chart with an average of $49,443 in four theaters. This is 22% lower than the film's opening weekend average, which isn't bad for a limited release. The Danish Girl opened in a close second place with $46,830, also in four theaters. The Hunger Games: Mockingjay - Part 2 earned first place on the overall chart and third place on the per theater chart with an average of $12,456. Janis: Little Girl Blue earned an average of $10,931 in two theaters, which is great for a documentary. The second wide release in the $10,000 club was The Good Dinosaur with an average of $10,444. More...

2015 - Awards Season: Independent Spirit Awards - Nominations

November 25th, 2015

Carol

Awards Season begins with the Independent Spirit Awards nominations. There were definitely some surprise nominees this year, but that also meant there were some unfortunate snubs as well. The overall leader was Carol, which just opened this past weekend. This is great timing and should help its box office numbers, as well as its chances throughout Awards Season. Its six nominations were one ahead of Beasts of No Nation and Spotlight. (One of Spotlight's was the Robert Altman Award, which has no nominations, just one winner.)

More...

Per Theater Chart: Carol Sings a Joyful Tune

November 24th, 2015

Carol

Carol had a festive opening earning just over $250,000 in four theaters for an average of $63,378. That's the third best average for an opening this year, just ahead of Ex Machina and just behind Sicario. The overall box office leader, The Hunger Games: Mockingjay - Part 2, was next with an average of $24,591. Legend was next with an average of $21,709 in four theaters. That's a good start, but its reviews suggest not so good legs. Speaking of long legs, Brooklyn remained in the $10,000 for the third week in a row earning an average of $10,270 in just over 100 theaters. More...

Weekend Wrap-Up: Moviegoers Satisfied with Final Course of Hunger Games

November 24th, 2015

The Hunger Games: Mockingjay, Part 2

The Curse of the High Expectations strikes again. The Hunger Games: Mockingjay, Part 2 became the fifth film of the year to open with more than $100 million. This should be a reason to celebrate, but it marks a very steep decline from previous films in the Hunger Games franchise. The other two wide releases, The Night Before and Secret in Their Eyes, both failed to meet expectations, leaving the overall box office softer than anticipated. Granted, it still grew 60% from last weekend to $173 million, but this is 10% lower than the same weekend last year. Year-to-date, 2015 is still ahead of 2014 by a comfortable margin of 3.6% or $320 million. It would take a sizable collapse for 2015 to not come out on top in terms of raw box office dollars. On the other hand, it wouldn't take too much for it to slip below ticket price inflation, which is about 2% this year. More...

Weekend Estimates: Mockingjay Tops $100 Million, But Only Just

November 22nd, 2015

Mockingjay Part 2

The Hunger Games: Mockingjay—Part 2 is about to record the most disappointing $100 million weekend ever, based on Sunday’s estimate from Lionsgate. Why disappointing? Because its $101.025 million projected opening follows the $158 million earned by Catching Fire on this weekend in 2013 (then the sixth-biggest weekend ever), and the $122 million debut of Mockingjay—Part 1 this weekend last year. That marks a decline of 20% or so from one installment of the franchise to the next, which is the worst performance of any franchise to have recorded a $100 million start. Global numbers tell a similar story: $247 million this weekend against Part 1’s $275 million. However, once we get that troubling statistic out the way, this is also a reason for celebration: $100 million domestically and $250 million globally in one weekend is still a huge amount of money, and caps a spectacularly successful franchise for Lionsgate. More...

Per Theater Chart: James Can't Take the Spotlight

November 17th, 2015

James White

There was only one new release in the $10,000 club and it had to settle for third place on the per theater chart. This left Spotlight in first place with an average of $22,561 in 60 theaters. This is a great result for a film expanding from five to 60 theaters. Brooklyn also expanded, going from five theaters to 23 theaters, while its per theater average remained strong with an average of $20,868. James White was the only new release in the $10,000 club debuting with $12,007 in its lone theater. More...

Weekend Estimates: Spectre Set to Be Number Two Bond

November 15th, 2015

Spectre

Sony are predicting a decline of just 50% for Spectre in its second weekend in theaters, putting James Bond’s latest incarnation on track for a final domestic box office in the neighborhood of $200 million. While well short of Skyfall’s $304 million, it welcome news for a film that’s probably right on the bubble as far as profitability is concerned. More...

Friday Estimates: Openers Fall Well Short of Spectre and Peanuts

November 14th, 2015

Spectre

Three new wide releases are all, as expected, struggling to make much headway against Spectre and The Peanuts Movie this weekend, with the two returning films sitting comfortably at the top of the chart. Spectre picked up an estimated $10.2 million on Friday for a total to date of $105.5 million, while Peanuts earned another $5.6 million, for $63.9 million so far. More...

Per Theater Chart: Spotlight Shines Bright

November 10th, 2015

Spotlight

It was a busy week on the per theater chart with seven films in the $10,000 club. Spotlight led the way with an average of $59,002 in five theaters. This is the fourth best opening weekend average of 2015, just ahead of While We're Young and just behind Ex Machina. Brooklyn was next with an average of $37,456, also in five theaters. It opened on Wednesday, so its weekend average was a little lower than it otherwise would have been. The overall number one film, Spectre, was third with an average of $17,919. In Jackson Heights was on the opposite end of the scale playing in just one theater. It did well with an opening of $15,150. Trumbo was very close behind with an average of $14,835 in five theaters. Its reviews suggest it won't expand significantly, but this is a great start. The second wide release of the week was The Peanuts Movie, which opened with an average of $11,345. The final film in the $10,000 club was Peggy Guggenheim - Art Addict, which earned an average of $11,129 in two theaters. More...

Weekend Estimates: Spectre Misses Record, Peanuts Opens Strong

November 8th, 2015

Spectre

After a great night on Thursday and a very good day on Friday, Spectre has faded a bit over the weekend. After posting $28 million on Friday, the film was down about 4% on Saturday to $26.5 million, and Sony is projecting a weekend total of $73 million. Even that number may be a shade high, and it falls well behind the $80 million that looked on the cards earlier in the weekend, and even further behind Skyfall’s franchise-record $88.4 million opening. While by any measure it’s a great debut, the final number does prompt the question: what went wrong over the weekend? More...

Limited and VOD Releases: Shining a Spotlight on Limited Releases

November 6th, 2015

Brooklyn

It is a short list this week, due to technical considerations. However, there are seven films here that are earning good reviews and some measure of pre-release buzz. The film with the best shot at mainstream success is Brooklyn (Reviews). It isn't the only film that could succeed, as Spotlight, Trumbo, and the rest could also find receptive audiences during Awards Season. More...

Compare this performance with other movies…

Domestic Cumulative Box Office Records

Weekend Box Office Performance

DateRankGross% ChangeTheatersPer TheaterTotal GrossWeek
Nov 6, 2015 23 $295,009   5 $59,002   $295,009 1
Nov 13, 2015 12 $1,353,630 +359% 60 $22,561   $1,800,400 2
Nov 20, 2015 8 $3,528,384 +161% 598 $5,900   $5,804,495 3
Nov 27, 2015 8 $4,408,252 +25% 897 $4,914   $12,260,141 4
Dec 4, 2015 8 $2,800,008 -36% 980 $2,857   $16,505,705 5
Dec 11, 2015 9 $2,508,853 -10% 1,089 $2,304   $20,302,802 6
Dec 18, 2015 12 $1,425,193 -43% 825 $1,728   $22,803,219 7
Dec 25, 2015 17 $1,083,976 -24% 480 $2,258   $24,899,059 8
Jan 1, 2016 15 $1,185,093 +9% 385 $3,078   $27,108,972 9
Jan 8, 2016 17 $928,471 -22% 368 $2,523   $28,546,477 10
Jan 15, 2016 14 $1,650,133 +78% 985 $1,675   $30,623,296 11
Jan 22, 2016 16 $1,273,626 -23% 1,030 $1,237   $32,902,971 12
Jan 29, 2016 15 $1,200,039 -6% 715 $1,678   $34,765,827 13
Feb 5, 2016 17 $835,514 -30% 668 $1,251   $36,104,348 14
Feb 12, 2016 20 $698,951 -16% 455 $1,536   $37,204,863 15
Feb 19, 2016 26 $522,353 -25% 401 $1,303   $38,102,424 16
Feb 26, 2016 21 $735,999 +41% 685 $1,074   $39,121,520 17
Mar 4, 2016 15 $1,766,212 +140% 1,227 $1,439   $41,562,351 18
Mar 11, 2016 16 $931,412 -47% 847 $1,100   $43,187,686 19
Mar 18, 2016 20 $423,465 -55% 443 $956   $44,000,003 20
Mar 25, 2016 25 $158,087 -63% 206 $767   $44,338,925 21
Apr 1, 2016 28 $151,034 -4% 202 $748   $44,571,689 22
Apr 8, 2016 35 $79,473 -47% 112 $710   $44,726,885 23
Apr 15, 2016 37 $45,247 -43% 103 $439   $44,808,479 24
Apr 22, 2016 41 $31,253 -31% 91 $343   $44,867,903 25
Apr 29, 2016 33 $95,676 +206% 224 $427   $44,988,180 26

Daily Box Office Performance

DateRankGross%YD%LWTheatersPer TheaterTotal GrossDays
Nov 6, 2015 - $89,387     5 $17,877   $89,387 1
Nov 7, 2015 - $118,272 +32%   5 $23,654   $207,659 2
Nov 8, 2015 - $87,350 -26%   5 $17,470   $295,009 3
Nov 9, 2015 - $35,108 -60%   5 $7,022   $330,117 4
Nov 10, 2015 - $33,370 -5%   5 $6,674   $363,487 5
Nov 11, 2015 - $53,126 +59%   5 $10,625   $416,613 6
Nov 12, 2015 - $30,157 -43%   5 $6,031   $446,770 7
Nov 13, 2015 12 $390,951 +1,196% +337% 60 $6,516   $837,721 8
Nov 14, 2015 11 $575,688 +47% +387% 60 $9,595   $1,413,409 9
Nov 15, 2015 11 $386,991 -33% +343% 60 $6,450   $1,800,400 10
Nov 16, 2015 9 $120,839 -69% +244% 60 $2,014   $1,921,239 11
Nov 17, 2015 14 $125,187 +4% +275% 60 $2,086   $2,046,426 12
Nov 18, 2015 8 $121,068 -3% +128% 60 $2,018   $2,167,494 13
Nov 19, 2015 9 $108,617 -10% +260% 60 $1,810   $2,276,111 14
Nov 20, 2015 7 $1,025,097 +844% +162% 598 $1,714   $3,301,208 15
Nov 21, 2015 8 $1,517,144 +48% +164% 598 $2,537   $4,818,352 16
Nov 22, 2015 8 $986,143 -35% +155% 598 $1,649   $5,804,495 17
Nov 23, 2015 8 $355,011 -64% +194% 598 $594   $6,159,506 18
Nov 24, 2015 8 $461,514 +30% +269% 598 $772   $6,621,020 19
Nov 25, 2015 8 $652,981 +41% +439% 897 $728   $7,274,001 20
Nov 26, 2015 10 $577,888 -12% +432% 897 $644   $7,851,889 21
Nov 27, 2015 8 $1,657,861 +187% +62% 897 $1,848   $9,509,750 22
Nov 28, 2015 8 $1,740,754 +5% +15% 897 $1,941   $11,250,504 23
Nov 29, 2015 7 $1,009,637 -42% +2% 897 $1,126   $12,260,141 24
Nov 30, 2015 6 $333,180 -67% -6% 897 $371   $12,593,321 25
Dec 1, 2015 7 $410,895 +23% -11% 897 $458   $13,004,216 26
Dec 2, 2015 6 $361,588 -12% -45% 897 $403   $13,365,804 27
Dec 3, 2015 6 $339,893 -6% -41% 897 $379   $13,705,697 28
Dec 4, 2015 7 $830,428 +144% -50% 980 $847   $14,536,125 29
Dec 5, 2015 8 $1,270,555 +53% -27% 980 $1,296   $15,806,680 30
Dec 6, 2015 8 $699,025 -45% -31% 980 $713   $16,505,705 31
Dec 7, 2015 7 $286,600 -59% -14% 980 $292   $16,792,305 32
Dec 8, 2015 7 $372,580 +30% -9% 980 $380   $17,164,885 33
Dec 9, 2015 7 $312,967 -16% -13% 980 $319   $17,477,852 34
Dec 10, 2015 7 $316,097 +1% -7% 980 $323   $17,793,949 35
Dec 11, 2015 8 $711,126 +125% -14% 1,089 $653   $18,505,075 36
Dec 12, 2015 9 $1,123,579 +58% -12% 1,089 $1,032   $19,628,654 37
Dec 13, 2015 9 $674,148 -40% -4% 1,089 $619   $20,302,802 38
Dec 14, 2015 8 $269,659 -60% -6% 1,089 $248   $20,572,461 39
Dec 15, 2015 8 $312,804 +16% -16% 1,089 $287   $20,885,265 40
Dec 16, 2015 8 $278,396 -11% -11% 1,089 $256   $21,163,661 41
Dec 17, 2015 8 $214,365 -23% -32% 1,089 $197   $21,378,026 42
Dec 18, 2015 12 $355,889 +66% -50% 825 $431   $21,733,915 43
Dec 19, 2015 10 $644,159 +81% -43% 825 $781   $22,378,074 44
Dec 20, 2015 11 $425,145 -34% -37% 825 $515   $22,803,219 45
Dec 21, 2015 11 $238,081 -44% -12% 825 $289   $23,041,300 46
Dec 22, 2015 12 $276,174 +16% -12% 825 $335   $23,317,474 47
Dec 23, 2015 12 $251,318 -9% -10% 825 $305   $23,568,792 48
Dec 24, 2015 12 $246,291 -2% +15% 825 $299   $23,815,083 49
Dec 25, 2015 - $322,037 +31% -10% 480 $671   $24,137,120 50
Dec 26, 2015 - $418,648 +30% -35% 480 $872   $24,555,768 51
Dec 27, 2015 - $343,291 -18% -19% 480 $715   $24,899,059 52
Dec 28, 2015 - $243,737 -29% +2% 480 $508   $25,142,796 53
Dec 29, 2015 - $246,174 +1% -11% 480 $513   $25,388,970 54
Dec 30, 2015 15 $263,502 +7% +5% 480 $549   $25,652,472 55
Dec 31, 2015 15 $271,407 +3% +10% 480 $565   $25,923,879 56
Jan 1, 2016 15 $426,538 +57% +32% 385 $1,108   $26,350,417 57
Jan 2, 2016 15 $486,253 +14% +16% 385 $1,263   $26,836,670 58
Jan 3, 2016 - $272,302 -44% -21% 385 $707   $27,108,972 59
Jan 4, 2016 - $114,365 -58% -53% 385 $297   $27,223,337 60
Jan 5, 2016 - $131,521 +15% -47% 385 $342   $27,354,858 61
Jan 6, 2016 - $131,565 n/c -50% 385 $342   $27,486,423 62
Jan 7, 2016 - $131,583 n/c -52% 385 $342   $27,618,006 63
Jan 8, 2016 - $246,724 +88% -42% 368 $670   $27,864,730 64
Jan 9, 2016 - $434,234 +76% -11% 368 $1,180   $28,298,964 65
Jan 10, 2016 - $247,513 -43% -9% 368 $673   $28,546,477 66
Jan 11, 2016 - $89,105 -64% -22% 368 $242   $28,635,582 67
Jan 12, 2016 - $103,362 +16% -21% 368 $281   $28,738,944 68
Jan 13, 2016 - $106,463 +3% -19% 368 $289   $28,845,407 69
Jan 14, 2016 - $127,756 +20% -3% 368 $347   $28,973,163 70
Jan 15, 2016 14 $448,142 +251% +82% 985 $455   $29,421,305 71
Jan 16, 2016 14 $667,773 +49% +54% 985 $678   $30,089,078 72
Jan 17, 2016 14 $534,218 -20% +116% 985 $542   $30,623,296 73
Jan 18, 2016 13 $422,032 -21% +374% 985 $428   $31,045,328 74
Jan 19, 2016 13 $217,236 -49% +110% 985 $221   $31,262,564 75
Jan 20, 2016 13 $182,478 -16% +71% 985 $185   $31,445,042 76
Jan 21, 2016 13 $184,303 +1% +44% 985 $187   $31,629,345 77
Jan 22, 2016 15 $370,025 +101% -17% 1,030 $359   $31,999,370 78
Jan 23, 2016 15 $610,541 +65% -9% 1,030 $593   $32,609,911 79
Jan 24, 2016 - $293,060 -52% -45% 1,030 $285   $32,902,971 80
Jan 25, 2016 14 $133,877 -54% -68% 1,030 $130   $33,036,848 81
Jan 26, 2016 14 $186,089 +39% -14% 1,030 $181   $33,222,937 82
Jan 27, 2016 12 $174,924 -6% -4% 1,030 $170   $33,397,861 83
Jan 28, 2016 12 $167,927 -4% -9% 1,030 $163   $33,565,788 84
Jan 29, 2016 14 $280,641 +67% -24% 715 $393   $33,846,429 85
Jan 30, 2016 14 $524,799 +87% -14% 715 $734   $34,371,228 86
Jan 31, 2016 14 $394,599 -25% +35% 715 $552   $34,765,827 87
Feb 1, 2016 14 $118,379 -70% -12% 715 $166   $34,884,206 88
Feb 2, 2016 14 $144,422 +22% -22% 715 $202   $35,028,628 89
Feb 3, 2016 14 $121,315 -16% -31% 715 $170   $35,149,943 90
Feb 4, 2016 14 $118,891 -2% -29% 715 $166   $35,268,834 91
Feb 5, 2016 - $229,797 +93% -18% 668 $344   $35,498,631 92
Feb 6, 2016 - $438,912 +91% -16% 668 $657   $35,937,543 93
Feb 7, 2016 - $166,805 -62% -58% 668 $250   $36,104,348 94
Feb 8, 2016 - $93,410 -44% -21% 668 $140   $36,197,758 95
Feb 9, 2016 - $117,697 +26% -19% 668 $176   $36,315,455 96
Feb 10, 2016 - $102,396 -13% -16% 668 $153   $36,417,851 97
Feb 11, 2016 - $88,061 -14% -26% 668 $132   $36,505,912 98
Feb 12, 2016 - $147,333 +67% -36% 455 $324   $36,653,245 99
Feb 13, 2016 - $287,301 +95% -35% 455 $631   $36,940,546 100
Feb 14, 2016 - $264,317 -8% +58% 455 $581   $37,204,863 101
Feb 15, 2016 - $153,304 -42% +64% 455 $337   $37,358,167 102
Feb 16, 2016 - $78,185 -49% -34% 455 $172   $37,436,352 103
Feb 17, 2016 - $71,148 -9% -31% 455 $156   $37,507,500 104
Feb 18, 2016 - $72,571 +2% -18% 455 $159   $37,580,071 105
Feb 19, 2016 - $122,641 +69% -17% 401 $306   $37,702,712 106
Feb 20, 2016 - $237,924 +94% -17% 401 $593   $37,940,636 107
Feb 21, 2016 - $161,788 -32% -39% 401 $403   $38,102,424 108
Feb 22, 2016 - $59,603 -63% -61% 401 $149   $38,162,027 109
Feb 23, 2016 - $74,503 +25% -5% 401 $186   $38,236,530 110
Feb 24, 2016 - $73,758 -1% +4% 401 $184   $38,310,288 111
Feb 25, 2016 - $75,233 +2% +4% 401 $188   $38,385,521 112
Feb 26, 2016 - $192,781 +156% +57% 685 $281   $38,578,302 113
Feb 27, 2016 - $372,067 +93% +56% 685 $543   $38,950,369 114
Feb 28, 2016 - $171,151 -54% +6% 685 $250   $39,121,520 115
Feb 29, 2016 12 $167,729 -2% +181% 685 $245   $39,289,249 116
Mar 1, 2016 13 $189,534 +13% +154% 685 $277   $39,478,783 117
Mar 2, 2016 12 $174,371 -8% +136% 685 $255   $39,653,154 118
Mar 3, 2016 12 $142,985 -18% +90% 685 $209   $39,796,139 119
Mar 4, 2016 13 $477,303 +234% +148% 1,227 $389   $40,273,442 120
Mar 5, 2016 14 $820,961 +72% +121% 1,227 $669   $41,094,403 121
Mar 6, 2016 14 $467,948 -43% +173% 1,227 $381   $41,562,351 122
Mar 7, 2016 13 $172,461 -63% +3% 1,227 $141   $41,734,812 123
Mar 8, 2016 13 $210,402 +22% +11% 1,227 $171   $41,945,214 124
Mar 9, 2016 13 $162,010 -23% -7% 1,227 $132   $42,107,224 125
Mar 10, 2016 14 $149,050 -8% +4% 1,227 $121   $42,256,274 126
Mar 11, 2016 - $248,330 +67% -48% 847 $293   $42,504,604 127
Mar 12, 2016 15 $429,611 +73% -48% 847 $507   $42,934,215 128
Mar 13, 2016 - $253,471 -41% -46% 847 $299   $43,187,686 129
Mar 14, 2016 - $100,319 -60% -42% 847 $118   $43,288,005 130
Mar 15, 2016 - $122,389 +22% -42% 847 $144   $43,410,394 131
Mar 16, 2016 - $91,792 -25% -43% 847 $108   $43,502,186 132
Mar 17, 2016 - $74,352 -19% -50% 847 $88   $43,576,538 133
Mar 18, 2016 - $106,040 +43% -57% 443 $239   $43,682,578 134
Mar 19, 2016 - $200,415 +89% -53% 443 $452   $43,882,993 135
Mar 20, 2016 - $117,010 -42% -54% 443 $264   $44,000,003 136
Mar 21, 2016 - $49,144 -58% -51% 443 $111   $44,049,147 137
Mar 22, 2016 - $51,601 +5% -58% 443 $116   $44,100,748 138
Mar 23, 2016 - $42,829 -17% -53% 443 $97   $44,143,577 139
Mar 24, 2016 - $37,261 -13% -50% 443 $84   $44,180,838 140
Mar 25, 2016 - $51,706 +39% -51% 206 $251   $44,232,544 141
Mar 26, 2016 - $65,667 +27% -67% 206 $319   $44,298,211 142
Mar 27, 2016 - $40,714 -38% -65% 206 $198   $44,338,925 143
Mar 28, 2016 - $22,393 -45% -54% 206 $109   $44,361,318 144
Mar 29, 2016 - $22,169 -1% -57% 206 $108   $44,383,487 145
Mar 30, 2016 - $18,400 -17% -57% 206 $89   $44,401,887 146
Mar 31, 2016 - $18,768 +2% -50% 206 $91   $44,420,655 147
Apr 1, 2016 - $44,188 +135% -15% 202 $219   $44,464,843 148
Apr 2, 2016 - $68,491 +55% +4% 202 $339   $44,533,334 149
Apr 3, 2016 - $38,355 -44% -6% 202 $190   $44,571,689 150
Apr 4, 2016 - $16,109 -58% -28% 202 $80   $44,587,798 151
Apr 5, 2016 - $23,358 +45% +5% 202 $116   $44,611,156 152
Apr 6, 2016 - $18,219 -22% -1% 202 $90   $44,629,375 153
Apr 7, 2016 - $18,037 -1% -4% 202 $89   $44,647,412 154
Apr 8, 2016 - $22,400 +24% -49% 112 $200   $44,669,812 155
Apr 9, 2016 - $38,304 +71% -44% 112 $342   $44,708,116 156
Apr 10, 2016 - $18,769 -51% -51% 112 $168   $44,726,885 157
Apr 11, 2016 - $8,070 -57% -50% 112 $72   $44,734,955 158
Apr 12, 2016 - $10,814 +34% -54% 112 $97   $44,745,769 159
Apr 13, 2016 - $7,462 -31% -59% 112 $67   $44,753,231 160
Apr 14, 2016 - $10,001 +34% -45% 112 $89   $44,763,232 161
Apr 15, 2016 - $14,211 +42% -37% 103 $138   $44,777,443 162
Apr 16, 2016 - $18,474 +30% -52% 103 $179   $44,795,917 163
Apr 17, 2016 - $12,562 -32% -33% 103 $122   $44,808,479 164
Apr 18, 2016 - $5,527 -56% -32% 103 $54   $44,814,006 165
Apr 19, 2016 - $8,070 +46% -25% 103 $78   $44,822,076 166
Apr 20, 2016 - $6,940 -14% -7% 103 $67   $44,829,016 167
Apr 21, 2016 - $7,634 +10% -24% 103 $74   $44,836,650 168
Apr 22, 2016 - $9,464 +24% -33% 91 $104   $44,846,114 169
Apr 23, 2016 - $15,237 +61% -18% 91 $167   $44,861,351 170
Apr 24, 2016 - $6,552 -57% -48% 91 $72   $44,867,903 171
Apr 25, 2016 - $3,538 -46% -36% 91 $39   $44,871,441 172
Apr 26, 2016 - $7,925 +124% -2% 91 $87   $44,879,366 173
Apr 27, 2016 - $5,865 -26% -15% 91 $64   $44,885,231 174
Apr 28, 2016 - $7,273 +24% -5% 91 $80   $44,892,504 175
Apr 29, 2016 - $22,575 +210% +139% 224 $101   $44,915,079 176
Apr 30, 2016 - $39,729 +76% +161% 224 $177   $44,954,808 177
May 1, 2016 - $33,372 -16% +409% 224 $149   $44,988,180 178
May 2, 2016 - $15,685 -53% +343% 224 $70   $45,003,865 179
May 3, 2016 - $17,881 +14% +126% 224 $80   $45,021,746 180
May 4, 2016 - $18,596 +4% +217% 224 $83   $45,040,342 181
May 5, 2016 - $15,434 -17% +112% 224 $69   $45,055,776 182

Weekly Box Office Performance

DateRankGross% ChangeTheatersPer TheaterTotal GrossWeek
Nov 6, 2015 23 $446,770   5 $89,354   $446,770 1
Nov 13, 2015 11 $1,829,341 +309% 60 $30,489   $2,276,111 2
Nov 20, 2015 10 $5,575,778 +205% 897 $6,216   $7,851,889 3
Nov 27, 2015 7 $5,853,808 +5% 897 $6,526   $13,705,697 4
Dec 4, 2015 8 $4,088,252 -30% 980 $4,172   $17,793,949 5
Dec 11, 2015 8 $3,584,077 -12% 1,089 $3,291   $21,378,026 6
Dec 18, 2015 13 $2,437,057 -32% 825 $2,954   $23,815,083 7
Dec 25, 2015 16 $2,108,796 -13% 480 $4,393   $25,923,879 8
Jan 1, 2016 16 $1,694,127 -20% 385 $4,400   $27,618,006 9
Jan 8, 2016 17 $1,355,157 -20% 368 $3,682   $28,973,163 10
Jan 15, 2016 14 $2,656,182 +96% 985 $2,697   $31,629,345 11
Jan 22, 2016 16 $1,936,443 -27% 1,030 $1,880   $33,565,788 12
Jan 29, 2016 15 $1,703,046 -12% 715 $2,382   $35,268,834 13
Feb 5, 2016 17 $1,237,078 -27% 668 $1,852   $36,505,912 14
Feb 12, 2016 20 $1,074,159 -13% 455 $2,361   $37,580,071 15
Feb 19, 2016 23 $805,450 -25% 401 $2,009   $38,385,521 16
Feb 26, 2016 16 $1,410,618 +75% 685 $2,059   $39,796,139 17
Mar 4, 2016 14 $2,460,135 +74% 1,227 $2,005   $42,256,274 18
Mar 11, 2016 18 $1,320,264 -46% 847 $1,559   $43,576,538 19
Mar 18, 2016 21 $604,300 -54% 443 $1,364   $44,180,838 20
Mar 25, 2016 25 $239,817 -60% 206 $1,164   $44,420,655 21
Apr 1, 2016 27 $226,757 -5% 202 $1,123   $44,647,412 22
Apr 8, 2016 35 $115,820 -49% 112 $1,034   $44,763,232 23
Apr 15, 2016 37 $73,418 -37% 103 $713   $44,836,650 24
Apr 22, 2016 39 $55,854 -24% 91 $614   $44,892,504 25
Apr 29, 2016 32 $163,272 +192% 224 $729   $45,055,776 26

Box Office Summary Per Territory

Territory Release
Date
Opening
Weekend
Opening
Weekend
Screens
Maximum
Screens
Theatrical
Engagements
Total
Box Office
Report
Date
Argentina 2/11/2016 $107,377 40 93 284 $603,774 5/6/2016
Australia 1/15/2016 $38,039 2 176 1,412 $4,057,743 6/9/2016
Austria 2/26/2016 $84,696 40 47 254 $601,753 6/9/2016
Belgium 2/3/2016 $95,581 28 53 236 $559,946 6/9/2016
Bolivia 2/4/2016 $7,462 7 7 22 $37,755 12/31/2018
Brazil 1/7/2016 $229,033 55 141 761 $1,940,004 6/9/2016
Bulgaria 2/19/2016 $9,689 28 28 103 $52,620 2/26/2019
Cambodia 4/8/2016 $1,151 18 18 18 $1,151 12/31/2018
Central America 1/7/2016 $41,801 32 32 50 $109,526 4/12/2016
Chile 2/11/2016 $34,001 13 20 100 $266,011 12/31/2018
Colombia 1/7/2016 $43,080 26 35 164 $241,208 12/31/2018
Croatia 2/18/2016 $19,717 28 28 98 $78,481 12/31/2018
Czech Republic 4/7/2016 $30,689 57 57 150 $82,951 12/31/2018
Denmark 2/25/2016 $82,144 61 61 229 $561,895 6/9/2016
Dominican Republic 1/14/2016 $7,688 4 4 6 $48,239 12/31/2018
Ecuador 1/15/2016 $27,179 24 24 88 $88,101 12/31/2018
Estonia 2/19/2016 $11,214 9 9 9 $11,214 6/9/2016
Finland 1/29/2016 $36,666 28 28 190 $329,234 6/9/2016
France 1/27/2016 $1,143,193 208 209 724 $3,121,913 6/9/2016
Germany 2/25/2016 $355,893 131 176 1,054 $3,026,187 6/9/2016
Greece 2/25/2016 $102,409 37 54 164 $521,154 6/9/2016
Hong Kong 2/18/2016 $98,980 21 21 72 $585,245 6/9/2016
Hungary 2/18/2016 $41,524 22 22 127 $255,701 12/31/2018
Iceland 1/29/2016 $7,172 5 5 26 $43,526 12/31/2018
India 2/19/2016 $86,012 77 77 283 $332,915 6/9/2016
Israel 1/21/2016 $53,218 16 16 167 $432,711 12/31/2018
Italy 2/18/2016 $760,225 184 328 1,228 $4,482,985 6/9/2016
Japan 4/15/2016 $624,874 110 110 110 $1,879,216 8/20/2018
Lithuania 2/19/2016 $0 0 29 52 $41,033 8/9/2016
Mexico 1/15/2016 $128,837 63 136 741 $1,314,401 6/9/2016
Netherlands 1/28/2016 $104,224 42 50 409 $995,903 11/18/2018
New Zealand 1/29/2016 $66,698 45 65 513 $544,998 6/9/2016
Norway 3/11/2016 $51,473 32 32 115 $313,431 6/9/2016
Peru 2/4/2016 $27,145 17 23 67 $192,420 12/31/2018
Philippines 2/10/2016 $8,581 20 20 20 $8,581 12/31/2018
Poland 2/5/2016 $99,891 70 72 366 $567,974 12/31/2018
Portugal 1/28/2016 $120,108 38 43 251 $579,330 6/9/2016
Romania 2/26/2016 $30,232 30 30 104 $133,905 12/31/2018
Russia (CIS) 2/12/2016 $48,212 0 0 0 $155,767 11/13/2018
Serbia and Montenegro 3/3/2016 $9,329 16 18 57 $47,526 12/31/2018
Singapore 1/21/2016 $85,854 17 23 71 $266,021 6/9/2016
Slovakia 4/7/2016 $23,634 59 59 115 $48,906 6/9/2016
Slovenia 2/18/2016 $4,086 5 5 28 $32,344 6/9/2016
South Korea 2/24/2016 $13,850 0 320 937 $1,945,435 3/24/2020
Spain 1/29/2016 $729,005 219 284 1,854 $4,492,604 11/17/2018
Sweden 2/12/2016 $44,590 27 47 211 $501,534 6/9/2016
Thailand 1/14/2016 $63,309 56 56 122 $183,997 6/9/2016
Turkey 1/29/2016 $38,855 16 24 111 $272,951 12/31/2018
United Kingdom 1/29/2016 $1,504,163 241 407 2,531 $8,955,708 6/9/2016
Uruguay 1/28/2016 $18,209 6 14 72 $148,259 12/31/2018
Venezuela 2/19/2016 $7,904 18 18 40 $34,446 6/9/2016
 
Rest of World $716,029
 
International Total$46,846,662 3/24/2020

International Cumulative Box Office Records


Worldwide Cumulative Box Office Records


Weekly US DVD Sales

DateRankUnits
this
Week
% ChangeTotal
Units
Spending
this
Week
Total
Spending
Weeks
in
Release
Feb 28, 2016742,250 42,250$717,828$717,8284
Mar 6, 20161022,178-48% 64,428$376,804$1,094,6325
Mar 13, 20162614,941-33% 79,369$253,848$1,348,4806

Weekly US Blu-ray Sales

DateRankUnits
this
Week
% ChangeTotal
Units
Spending
this
Week
Total
Spending
Weeks
in
Release
Feb 28, 2016336,651 36,651$732,645$732,6454
Mar 6, 2016436,421-1% 73,072$728,049$1,460,6945
Mar 13, 20161412,127-67% 85,199$241,932$1,702,6266

Our DVD and Blu-ray sales estimates are based on weekly retail surveys, which we use to build a weekly market share estimate for each title we are tracking. The market share is converted into a weekly sales estimate based on industry reports on the overall size of the market, including reports published in Media Play News.

For example, if our weekly retail survey estimates that a particular title sold 1% of all units that week, and the industry reports sales of 1,500,000 units in total, we will estimate 15,000 units were sold of that title. The consumer spending estimate is based on the average sales price for the title in the retailers we survey.

We refine our estimates from week to week as more data becomes available. In particular, we adjust weekly sales figures for the quarter once the total market estimates are published by the Digital Entertainment Group. Figures will therefore fluctuate each week, and totals for individual titles can go up or down as we update our estimates.

Because sales figures are estimated based on sampling, they will be more accurate for higher-selling titles.

Full financial estimates for this film, including domestic and international box office, video sales, video rentals, TV and ancillary revenue are available through our research services. For more information, please contact us at research@the-numbers.com.