Box Office History for Hotel Transylvania Movies
Register with The Numbers for free to customize this chart.
| Release Date | Title | Production Budget | Opening Weekend | Domestic Box Office | Worldwide Box Office |
|---|---|---|---|---|---|
| Jan 14, 2022 | Hotel Transylvania: Transfo… | $18,480,000 | |||
| Unknown | Monster Pets: A Hotel Trans… | ||||
| Jul 13, 2018 | Hotel Transylvania 3: Summe… | $65,000,000 | $44,076,225 | $167,500,092 | $528,500,000 |
| Sep 25, 2015 | Hotel Transylvania 2 | $80,000,000 | $48,464,322 | $169,700,110 | $474,800,000 |
| Sep 28, 2012 | Hotel Transylvania | $85,000,000 | $42,522,194 | $148,313,048 | $378,119,469 |
| Averages | $76,666,667 | $45,020,914 | $161,837,750 | $349,974,867 | |
| Totals | 5 | $230,000,000 | $485,513,250 | $1,399,899,469 | |
Video Release Breakdown
| Release Date | Title | Domestic Video Sales to Date | Watch Now |
|---|---|---|---|
| Jan 29, 2013 | Hotel Transylvania | $100,108,663 | Netflix Hulu Amazon iTunes Google Vudu |
| Dec 22, 2015 | Hotel Transylvania 2 | $42,608,872 | Netflix Amazon iTunes Google Vudu |
| Feb 7, 2017 | Hotel Transylvania/Hotel Transylvania 2 | ||
| Oct 9, 2018 | Hotel Transylvania: Three Movie Collection | $9,849,664 | iTunes Google Vudu |
| Oct 9, 2018 | Hotel Transylvania 3: Summer Vacation | $38,647,804 | Amazon Google Vudu |
| Jan 14, 2022 | Hotel Transylvania: Transformania | iTunes Vudu Amazon | |
| Aug 15, 2023 | Hotel Transylvania 4-Movie Collection | Vudu | |
| Totals | $191,215,003 | ||
Our DVD and Blu-ray sales estimates are based on weekly retail surveys, which we use to build a weekly market share estimate for each title we are tracking. The market share is converted into a weekly sales estimate based on industry reports on the overall size of the market, including reports published in Media Play News.
For example, if our weekly retail survey estimates that a particular title sold 1% of all units that week, and the industry reports sales of 1,500,000 units in total, we will estimate 15,000 units were sold of that title. The consumer spending estimate is based on the average sales price for the title in the retailers we survey.
We refine our estimates from week to week as more data becomes available. In particular, we adjust weekly sales figures for the quarter once the total market estimates are published by the Digital Entertainment Group. Figures will therefore fluctuate each week, and totals for individual titles can go up or down as we update our estimates.
Because sales figures are estimated based on sampling, they will be more accurate for higher-selling titles.
Home Market Releases for October 9th, 2018
October 9th, 2018
-1-News.jpg)
It’s not a bad week on the home market. The two biggest releases, Hotel Transylvania 3: Summer Vacation and Skyscraper, are both worth checking out, but not close to being Pick of the Week contenders. As for the best of the best, Eighth Grade is really the only choice, while Thelma Todd & Zasu Pitts: The Hal Roach Collection was the runner up. Killing Eve: Season One and Recovery of an MMO Junkie: The Complete Series could have been contenders, if they had significant extras.
More...
International Box Office: Fallout Spreads to China with $77.64 million
September 5th, 2018

Mission: Impossible—Fallout rocketed into first place with $89.1 million in 65 theaters over the weekend for totals of $442.7 million internationally and $647.1 million worldwide. The film debuted in first place in China with $76.14 million over the weekend for a total opening of $77.64 million. It had to settle for second place in Italy with $2.22 million, as Hotel Transylvania 3: Summer Vacation remained in first place in that market. It won’t take long before this film takes over top spot in the franchise.
More...
International Box Office: Ant-Man has a Giant-Sized Chinese Debut
August 29th, 2018

Ant-Man and the Wasp jumped into first place on the international chart earning $71.2 million in 28 markets for totals of $332.6 million internationally and $544.1 million worldwide. This past weekend, the film debuted in first place in China with $66.62 million over the weekend for a total opening of $68.14 million. This is the fourth biggest opening for the MCU in that market and 66% more than the original opened with. The film opens in Japan, its final market, next weekend. It should get to $600 million worldwide shortly after it debuts there.
More...
International Box Office: The Meg Continues to Terrorize the Competition
August 21st, 2018
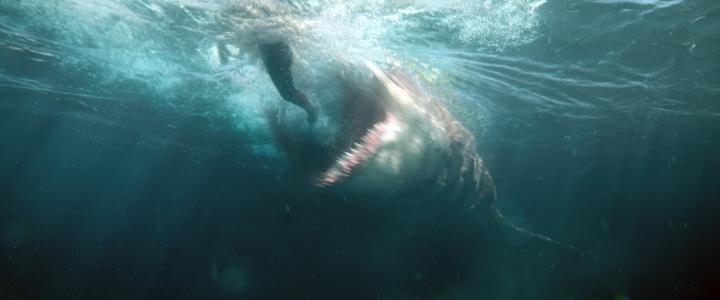
The Meg remained in first place on the international chart with $68.9 million on 23,767 screens in 55 markets, for totals of $232.2 million internationally and $316.0 million worldwide. Its biggest new market of the weekend was Australia, where it earned first place with $2.48 million on 413 screens. It also opened in South Korea, but struggled with $1.57 million on 598 screens over the weekend for a total opening of $3.19 million. Its biggest market overall was China, where it added $30.78 million over the weekend for a two-week total of $117.09 million. It fell just 38% during its sophomore stint, while it actually rose to second place, despite there being four new releases in the top ten. That’s stunning.
More...
Weekend Wrap-Up: July Ends on an Impossibly Good Weekend
July 30th, 2018
Mission: Impossible—Fallout was easily the biggest hit of the weekend earning more than the rest of the top five combined. Its opening weekend of $61.24 million was the best in the franchise, but it wasn’t enough to prevent the overall box office from dropping 9.3% from last weekend earning $156 million. This is 8.0% higher than the same weekend last year, which is the more important result. 2018 is now ahead of 2017 by a margin of 8.5% or $570 million at $7.23 billion to $6.66 billion.
More...
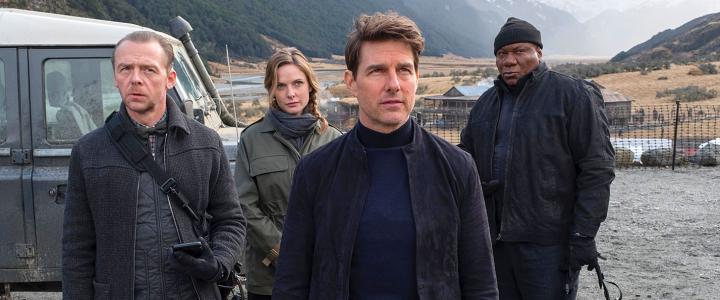
Weekend Estimates: Impossible Tops Chart with Franchise Best $61.5 million Debut
July 29th, 2018

Mission: Impossible—Fallout dominated the weekend box office chart with $61.5 million over the weekend. This is the best opening in the franchise, unless you take inflation into account. Assuming the film can have the same legs as Rogue Nation, it will be able to top $200 million domestically. The film’s reviews and its A from CinemaScore, and the nearly total lack of quality competition in August, make that seem likely; however, I think we should wait a week before predicting a final box office tally. Internationally, the film made $92 million in 36 markets, which is close to 20% higher than Rogue Nation’s debuts in those markets, which should be enough to keep Paramount happy. Although given the studio’s struggles in the past few years, if the film was just marginally profitable, it would have been reason for Paramount to celebrate.
More...
Weekend Predictions: Can Teen Titans do the Impossible?
July 26th, 2018
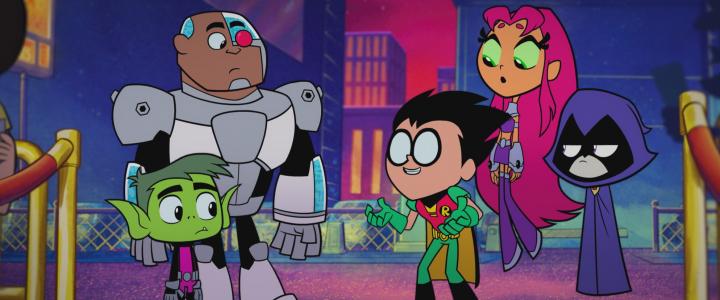
The last weekend of the month has two wide releases, both of which are earning stellar reviews. Mission: Impossible—Fallout is the sixth film in the franchise. It wasn’t that long ago where a sixth installment in a franchise would be impressive. Teen Titans Go! To the Movie is the first big screen appearance for most of these characters. There should also be three, maybe four other films with $10 million or more during the weekend. 2018 won’t need that depth to win in the year-over-year comparison, as this weekend last year was pretty weak, so the month should end on a winning note.
More...
Weekend Estimates: Equalizer more than Equals Mamma Mia
July 22nd, 2018

In a shocking turn of events, The Equalizer 2 overtook Mamma Mia: Here We Go Again! over the weekend with $35.83 million. This is better than predicted and is better than the original managed. Its reviews are not great, but it earned an A from CinemaScore and it is aimed at a more mature target audience, so it should have better than average legs. We will have a better picture this time next week. Internationally, the film managed $3.3 million on 704 screens in 11 markets, including $2.2 million in Australia. The film first didn’t do great internationally, so while this is a 30% improvement, it is still nothing special.
More...
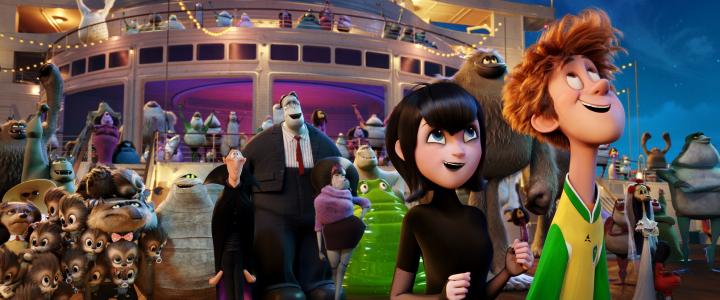
Weekend Wrap-Up: Summer Vacation Boosts Transylvania’s Debut
July 17th, 2018
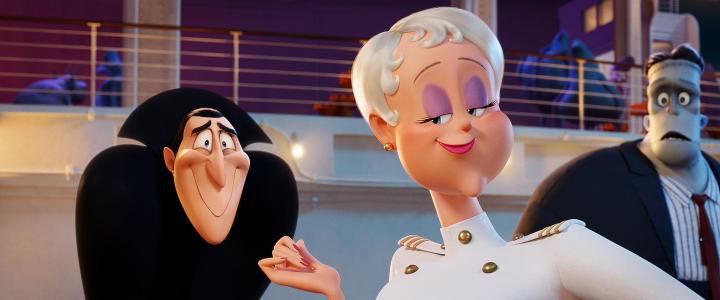
The weekend wasn’t nearly as close as expected. Hotel Transylvania 3: Summer Vacation ran away at the box office, while fellow new release, Skyscraper, only managed third place. This did allow Ant-Man and the Wasp to earn second place during its second weekend of release. Overall, the box office fell 12% compared to last weekend, but it was 1.6% higher than the same weekend last year. Granted, this is not a high enough margin of victory to compensate for ticket price inflation, but 2018 has such a large lead that even a small victory like this is more than enough to feel good about the overall box office. Speaking of large leads, 2018’s lead over 2017 remains impressive at $550 million or 8.9% at $6.72 billion to $6.17 billion.
More...
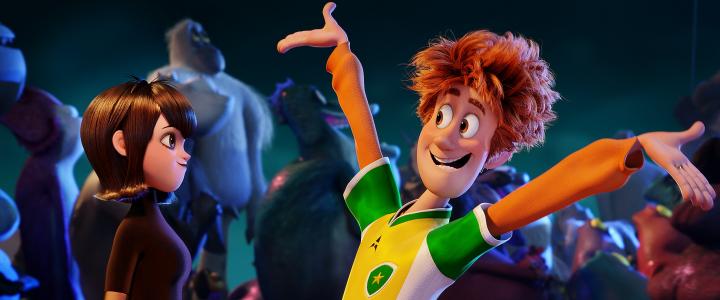
Weekend Estimates: Transylvania Triumphant, Skyscraper Sinks
July 15th, 2018
It was not a close race at the box office this weekend, as Hotel Transylvania 3: Summer Vacation topped expectations and Skyscraper did not. Transylvania 3 will open with a projected $44.1 million over the weekend for a total opening of $45.4 million, including June 30th’s special showings. This is average for the franchise, as is its reviews and A minus CinemaScore. The film will have no trouble earning enough to cover its $65 million production budget domestically. Meanwhile, the film opened with $46.4 million on 12,600 screens in 442 markets internationally, representing just under half of the total international marketplace. Its biggest market was Mexico, where it earned $8.6 million, while it was also impressive in Russia with $5.8 million. Its only holdover is Australia, where it added $2.4 million to its running tally, which sits at $10.2 million after three weeks of release.
More...
Friday Estimates: Smooth Sailing for Transylvania, Skyscraper Burning Down
July 14th, 2018

Hotel Transylvania 3: Summer Vacation easily won the box office race on Friday with $16.65 million during its opening day. This is a bit better than expected and puts it on pace for an opening weekend of $44 million, including special previews that took place June 30th. Its reviews are just below the overall positive level, while it managed an A minus from CinemaScore. That’s as low as a family film can go before it would hurt its legs. It should get to $100 million domestically without difficulty, but it won’t match the previous films in the franchise. It will break even and could even justify a fourth film.
More...
Weekend Predictions: Will Transylvania have a Buoyant Vacation? Or can Skyscraper Stand Tall?
July 12th, 2018
There should be a close race at the top of the box office this weekend, as both Hotel Transylvania 3: Summer Vacation and Skyscraper have a real shot at $40 million over the weekend. In fact, there’s a good chance both films will earn first place at least one day over the weekend. Meanwhile, Ant-Man and the Wasp will be pushed into third place, but will still be a solid box office performer. It’s this depth that is key, because the top two films from this weekend last year, War for the Planet of the Apes and Spider-Man: Homecoming, both earned more than either of the two new releases this year are expected to earn. 2018 is weak at the top, but the depth gives the weekend a great shot at coming out ahead in the year-over-year comparison.
More...
2018 Preview: July
July 1st, 2018

June was amazing, with two absolute monster hits and a solid $100 million hit. By the end of the month, 2018’s lead over 2017 will be well over $500 million, or close to 10%. Even if 2018 only managed to maintain this lead in terms of raw numbers for the rest of the year, it will be a massive jump at the box office. As for July, there are a couple of potential monster hits, Ant-Man and the Wasp and Mission: Impossible—Fallout, plus four potential $100 million hits. Last July, there was only one monster hit, Spider-Man: Homecoming, and three $100 million hits. I don’t think 2018 will match 2017 at the top, but 2018 appears to have more depth and that should put it a little ahead over the full month.
More...
Home Market Releases for October 17th, 2017
October 18th, 2017
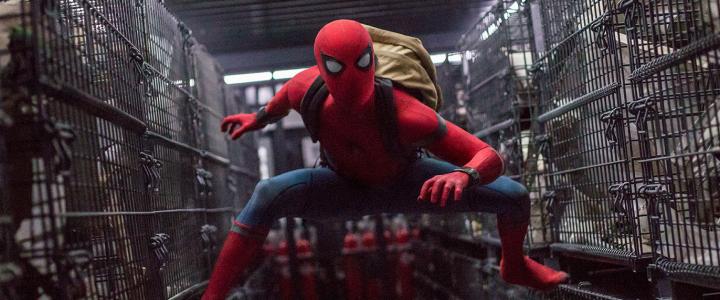
It is one of those weeks. There’s a massive release coming out, which has scared away nearly all of the competition, so it is a really shallow week. Fortunately, that huge release is Spider-Man: Homecoming, which is not only one of the biggest hits of the year, it is also one of the reviewed. It isn’t the only contender for Pick of the Week, but the Blu-ray Combo Pack wins that honor.
More...
2016 Preview: January
January 1st, 2016

2016 will begin the same way 2015 ended, with Star Wars: The Force Awakens on top. In fact, three of the five films that have the best shot at box office success in January are The Force Awakens, The Hateful Eight, and The Revenant, all of which opened in December. There are two true January releases that could also do really well, for this time of year: Ride Along 2 and Kung Fu Panda 3. The rest of the releases are just hoping to become midlevel hits. Last January, American Sniper dominated earning more than $300 million. Its success could prevent 2016 from being ahead in the year-over-year comparison by the end of the month, but this year does have better depth.
More...
International Box Office: Spectre Nearly Another Milestone
November 10th, 2015
As expected, Spectre remained in first pulling in $117.8 million in 73 markets for totals of $223.1 million internationally and $293.1 million worldwide. This is almost as much as it cost to make, so if it can double this figure, it should be able to break even eventually. The film's biggest market was the U.K. where it added $19.99 million on 696 screens over the weekend for a total of $98.82 million. It has already overtaken Jurassic World for the biggest hit of the year in the U.K. and should have no trouble rocketing into the top five on the all-time chart there. The film's biggest opening was in Germany, where it pulled in $18.06 million on 1,460 screens over the weekend for a total opening of $20.26 million. This is about 15% lower than Skyfall's opening in that market. Likewise, the film wasn't as strong during its debut in Russia earning $6.29 million on 2,112 screens, compared to $8.27 million on 1,254 screens for Skyfall. At this pace, Spectre will definitely fail to match Skyfall, but anything close to $800 million will be enough to break even, perhaps before it reaches the home market. It all depends on how much its global advertising campaign cost.
More...
International Box Office: Martian Completes Another Orbit
October 28th, 2015
The Martian returned to first place with $30.0 million in 73 markets for totals of $218.8 million internationally and $385.0 million worldwide. The film's only major market opening was in France where it earned second place with $6.81 million on 560 screens. It also remained in first place in South Korea with $3.99 million on 731 screens over the weekend for a three-week total of $28.43 million. I don't know if it has broken even yet, but it is very close to getting there.
More...
Weekend Wrap-Up: Goosebumps Leads Unstimulating Weekend
October 20th, 2015
It is hard to get excited about the weekend box office results, as the top four films all missed predictions. (Granted, Bridge of Spies came within a rounding error of expectations.) Goosebumps did well for a live-action family film, but still not great. The Martian fell faster than anticipated, but it was Crimson Peak that was the biggest disappointment. Overall, the box office rose 2.5% from last weekend to $121 million. However, this was 7.6% lower than the same weekend last year. Had every film in the top five matched expectations, then this gap would have been reduced to just a percent or two. Despite this, 2015 is still ahead of 2014 by more than $400 million at $8.46 billion to $8.05 billion. It would take a few more weeks of year-over-year declines before I would be concerned.
More...
International Box Office: Mars is in Ascension
October 8th, 2015
The Martian opened in first place with $45.2 million on 9,299 screens in 50 markets. This includes a first place, 10.01 million opening on 582 theaters in the U.K. This was the biggest opening for both the director and the star. The film had a similarly strong opening in Australia earning first place with $4.28 million on 582 screens. It also earned first place in Hong Kong ($2.26 million on 70 screens) and Taiwan ($1.68 million on 137 screens). It only managed second place in Italy with $2.53 million on 464 screens and in Mexico with $2.9 million on 1,757, while it debuted in third place in Brazil with $1.82 million on 507. Overall, the film it doing about as well internationally as it did here, which is good news for Fox.
More...
Friday Estimates: Hotel Fully Booked
September 26th, 2015
As expected, Hotel Transylvania 2 earned first place on Friday, but it did so with an unexpectedly strong result. The film pulled in $13.25 million for the day; by comparison, this is 21% higher than the first film’s debut. Sequels do tend to be a little more front loaded than the original film, but this is still a fantastic start. For instance, Cloudy with a Chance of Meatballs had a 3.72 internal multiplier of (weekend box office divided by Friday box office) while its sequel had an internal multiplier of 3.68. Granted, that's a tiny drop, but the reviews of these two films dropped dramatically, which likely had some effect. On the other hand, the two Hotel Transylvania films have earned nearly identical reviews. Hotel Transylvania earned an internal multiplier of 3.88, so if that drops to about 3.7, then Hotel Transylvania 2 would pull in about $49 million over the weekend. That's seems excessive. On the other hand, even earning just over $42.5 million and breaking the September record would be disappointing after an opening day like this.
More...
Note: This list contains actors who appeared in at least two movies in the franchise.
| Person | Nr. of Movies | Role | Franchise Worldwide Box Office | Career Worldwide Box Office | Franchise / Career |
|---|---|---|---|---|---|
| Andy Samberg | 4 | Johnnystein | $1,399,899,469 | $3,567,722,243 | 39.2% |
| Selena Gomez | 4 | Mavis | $1,399,899,469 | $2,238,544,846 | 62.5% |
| Steve Buscemi | 4 | Wayne | $1,399,899,469 | $7,028,352,363 | 19.9% |
| David Spade | 4 | Griffin the Invisible Man | $1,399,899,469 | $3,093,606,228 | 45.3% |
| Fran Drescher | 4 | Eunice | $1,399,899,469 | $1,840,777,897 | 76.0% |
| Molly Shannon | 4 | Wanda | $1,399,899,469 | $3,444,445,088 | 40.6% |
| Adam Sandler | 3 | Count Dracula | $1,381,419,469 | $5,563,187,002 | 24.8% |
| Kevin James | 3 | Frankenstein | $1,381,419,469 | $3,857,384,328 | 35.8% |
| Keegan-Michael Key | 3 | Murray | $1,021,780,000 | $8,445,483,467 | 12.1% |
| Asher Blinkoff | 3 | Dennis Loughran | $1,021,780,000 | $1,021,780,000 | 100.0% |
| Kathryn Hahn | 2 | Ericka Van Helsing | $546,980,000 | $3,147,969,528 | 17.4% |
| Mel Brooks | 2 | Vlad | $1,003,300,000 | $3,374,246,810 | 29.7% |
| Jim Gaffigan | 2 | Abraham Van Helsing | $546,980,000 | $1,014,979,381 | 53.9% |
| Jon Lovitz | 2 | Quasimodo | $852,919,469 | $2,350,070,863 | 36.3% |
| Sadie Sandler | 2 | Winnie | $1,003,300,000 | $1,375,332,545 | 72.9% |
| Sunny Sandler | 2 | Baby Dennis, Vampire Kid | $1,003,300,000 | $1,375,332,545 | 72.9% |
| Chris Parnell | 2 | Stan/Fish Man | $1,003,300,000 | $1,980,990,842 | 50.6% |
| Grant George | 2 | Additional Voice | $1,003,300,000 | $1,128,489,069 | 88.9% |
| Aaron LaPlante | 2 | Gremlins/Gremlin Pilot/Gremlin Stewardess | $1,003,300,000 | $1,003,300,000 | 100.0% |
| Patrick Harpin | 2 | Austrian Boy | $1,003,300,000 | $1,003,300,000 | 100.0% |
| Michelle Murdocca | 2 | Phone Voice/Kelsey/Witch 1/Witch 2 | $1,003,300,000 | $1,003,300,000 | 100.0% |
| Brian T. Delaney | 2 | Additional Voice | $1,003,300,000 | $5,477,883,258 | 18.3% |
| Jessica Gee-George | 2 | Additional Voice | $1,003,300,000 | $1,003,300,000 | 100.0% |
| Todd Haberkorn | 2 | Additional Voice | $1,003,300,000 | $1,061,708,363 | 94.5% |
| Mona Marshall | 2 | Additional Voice | $1,003,300,000 | $6,276,732,566 | 16.0% |
| Lex Lang | 2 | Additional Voice | $1,003,300,000 | $1,483,817,631 | 67.6% |
| Joseph Sanfelippo | 2 | Additional Voice | $1,003,300,000 | $1,441,371,176 | 69.6% |
| Caitlin McKenna | 2 | Additional Voice | $1,003,300,000 | $1,644,970,202 | 61.0% |
| Fred Tatasciore | 2 | Additional Voice | $1,003,300,000 | $6,674,667,489 | 15.0% |
| Audrey Wasilewski | 2 | Additional Voice | $1,003,300,000 | $1,276,441,996 | 78.6% |
| Michael-Leon Wooley | 2 | Additional Voice | $1,003,300,000 | $1,274,297,378 | 78.7% |
| Kirk Thornton | 2 | Additional Voice | $1,003,300,000 | $1,062,881,592 | 94.4% |
| Kari Wahlgren | 2 | Additional Voice | $1,003,300,000 | $2,528,251,053 | 39.7% |
| Debra Wilson | 2 | Additional Voice | $1,003,300,000 | $2,927,851,418 | 34.3% |
Note: This list contains people who contributed to at least two movies in the franchise.
| Person | Nr. of Movies | Technical Role | Franchise Worldwide Box Office | Career Worldwide Box Office | Franchise / Career |
|---|---|---|---|---|---|
| Genndy Tartakovsky | 4 |
Director (3) Screenwriter (2) Executive Producer (1) Story by (1) |
$1,399,899,469 | $1,400,586,198 | 100.0% |
| Michelle Murdocca | 4 |
Producer (3) Executive Producer (1) |
$1,399,899,469 | $1,591,831,627 | 87.9% |
| Mark Mothersbaugh | 3 | Composer (3) | $1,381,419,469 | $6,732,105,565 | 20.5% |
| Jennifer Kluska | 3 |
Story Artist (2) Director (1) |
$1,021,780,000 | $1,219,358,586 | 83.8% |
| Michael Semanick | 3 | Re-recording Mixer (3) | $1,381,419,469 | $17,923,498,478 | 7.7% |
| Geoffrey G. Rubay | 3 | Supervising Sound Editor (3) | $1,381,419,469 | $5,026,396,748 | 27.5% |
| Todd Durham | 2 | Story Creator (2) | $906,619,469 | $906,619,469 | 100.0% |
| Robert Smigel | 2 |
Screenwriter (2) Executive Producer (2) |
$852,919,469 | $1,206,349,677 | 70.7% |
| Kevin Hageman | 2 | Story Creator (2) | $906,619,469 | $1,807,316,013 | 50.2% |
| Adam Sandler | 2 |
Screenwriter (1) Executive Producer (1) |
$852,919,469 | $4,825,495,786 | 17.7% |
| Dan Hageman | 2 | Story Creator (2) | $906,619,469 | $1,807,316,013 | 50.2% |
| Catherine Apple | 2 |
Editor (2) Cinematographer (1) |
$852,919,469 | $1,231,127,361 | 69.3% |
| Craig Kellman | 2 | Character Designer (2) | $1,003,300,000 | $2,908,755,906 | 34.5% |
| Alan Hawkins | 2 | Senior Animation Supervisor (2) | $1,003,300,000 | $1,475,271,235 | 68.0% |
| Chad Ellis | 2 | Supervising Animator (2) | $1,003,300,000 | $1,417,443,425 | 70.8% |
| Mary Hidalgo | 2 | Casting (2) | $852,919,469 | $7,469,665,328 | 11.4% |
| Keith Baxter | 2 | Story Artist (2) | $1,003,300,000 | $1,233,509,185 | 81.3% |
| David Feiss | 2 | Story Artist (2) | $1,003,300,000 | $2,432,130,304 | 41.3% |
| Patrick Harpin | 2 | Story Artist (2) | $1,003,300,000 | $1,417,443,425 | 70.8% |
| Denise Koyama | 2 | Story Artist (2) | $1,003,300,000 | $1,576,343,213 | 63.6% |
| David Krentz | 2 | Story Artist (2) | $1,003,300,000 | $1,466,935,303 | 68.4% |
| John Pospisil | 2 | Sound Designer (2) | $906,619,469 | $2,524,252,378 | 35.9% |
| Darrell Rooney | 2 | Story Artist (2) | $1,003,300,000 | $1,003,300,000 | 100.0% |
| Henry Yu | 2 | Story Artist (2) | $1,003,300,000 | $1,004,072,558 | 99.9% |
| Andre Medina | 2 | Character Designer (2) | $1,003,300,000 | $1,530,878,020 | 65.5% |
| Margaret Johnson-Holzendorf | 2 | Associate Editor (2) | $1,003,300,000 | $1,003,300,000 | 100.0% |
| Christopher Alex Logan | 2 | Character Effects Supervisor (2) | $1,003,300,000 | $1,200,878,586 | 83.5% |
| Jessica Smialek | 2 | Post-Production Supervisor (2) | $1,003,300,000 | $1,855,514,601 | 54.1% |
| Curt Schulkey | 2 |
Dialogue Editor (1) Supervising Sound Editor (1) |
$1,003,300,000 | $5,023,194,432 | 20.0% |
| Ryan Collins | 2 | Sound Effects Editor (2) | $1,003,300,000 | $2,243,564,231 | 44.7% |