Box Office History for Avengers Movies
Register with The Numbers for free to customize this chart.
| Release Date | Title | Production Budget | Opening Weekend | Domestic Box Office | Worldwide Box Office |
|---|---|---|---|---|---|
| May 7, 2027 | Avengers: Secret Wars | ||||
| May 1, 2026 | Avengers: The Kang Dynasty | ||||
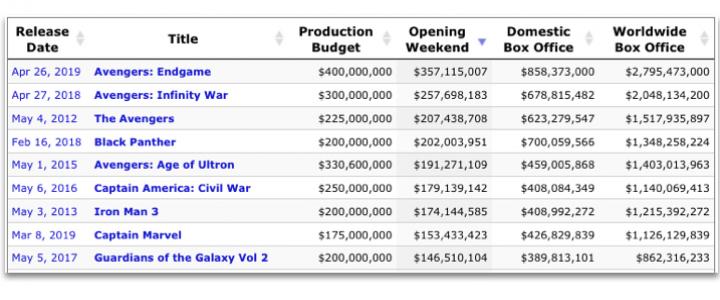
| Apr 26, 2019 | Avengers: Endgame | $400,000,000 | $357,115,007 | $858,373,000 | $2,788,912,285 |
| Apr 27, 2018 | Avengers: Infinity War | $300,000,000 | $257,698,183 | $678,815,482 | $2,048,359,754 |
| May 1, 2015 | Avengers: Age of Ultron | $365,000,000 | $191,271,109 | $459,005,868 | $1,395,316,979 |
| May 4, 2012 | The Avengers | $225,000,000 | $207,438,708 | $623,357,910 | $1,515,100,211 |
| Averages | $322,500,000 | $253,380,752 | $654,888,065 | $1,936,922,307 | |
| Totals | 6 | $1,290,000,000 | $2,619,552,260 | $7,747,689,229 | |
Video Release Breakdown
| Release Date | Title | Domestic Video Sales to Date | Watch Now |
|---|---|---|---|
| Sep 25, 2012 | The Avengers | $251,968,148 | Disney+ Amazon iTunes |
| Sep 8, 2015 | The Avengers: Age of Ultron | $91,668,672 | Disney+ Amazon iTunes |
| Jul 31, 2018 | Avengers: Infinity War | $104,069,254 | Disney+ Amazon iTunes Google Vudu |
| Jul 30, 2019 | Avengers: Endgame | $107,860,923 | Amazon iTunes Google Vudu |
| Aug 13, 2019 | Avengers 4-Movie Collection | $1,070,089 | Vudu |
| Dec 31, 2026 | Avengers: The Kang Dynasty | ||
| Dec 31, 2027 | Avengers: Secret Wars | ||
| Totals | $556,637,086 | ||
Our DVD and Blu-ray sales estimates are based on weekly retail surveys, which we use to build a weekly market share estimate for each title we are tracking. The market share is converted into a weekly sales estimate based on industry reports on the overall size of the market, including reports published in Media Play News.
For example, if our weekly retail survey estimates that a particular title sold 1% of all units that week, and the industry reports sales of 1,500,000 units in total, we will estimate 15,000 units were sold of that title. The consumer spending estimate is based on the average sales price for the title in the retailers we survey.
We refine our estimates from week to week as more data becomes available. In particular, we adjust weekly sales figures for the quarter once the total market estimates are published by the Digital Entertainment Group. Figures will therefore fluctuate each week, and totals for individual titles can go up or down as we update our estimates.
Because sales figures are estimated based on sampling, they will be more accurate for higher-selling titles.
Weekend predictions: Thor shooting for second-best weekend of 2022
July 8th, 2022
-1-News.jpg)
Top Gun: Maverick, Jurassic World: Dominion, Minions: The Rise of Gru, and now Thor: Love and Thunder. The first three films to open over $100 million since Memorial Day weekend are about to be joined by a fourth, and all of them share a common characteristic: a colon in their title. Coincidence? Yes.
And also, no.
More...
Holiday theater counts: three wide releases debut today, but Spider-Man remains widest
December 22nd, 2021
-3-News.jpg)
As the Christmas holiday approaches, there are plenty of options for movie-goers. The only question is what to watch? Spider-Man: No Way Home opened last Friday and took nearly everyone by surprise as it posted an opening domestic weekend of $260 million, placing itself between 2019’s Avengers: Endgame and 2018’s Avengers: Infinity War as the second-biggest opening of all time. The film is currently showing in 4,336 locations, which makes it the 30th-widest opening of all time, just behind Guardians of the Galaxy Vol 2. Spider-Man: No Way Home might not be challenged at the box office, but there are still a wide array of films for every interest.
More...
New at The Numbers: Sorting on Franchise Pages
October 30th, 2019
We've had a lot of helpful user feedback over the past week, and a popular feature we've been asked to implement is the ability to sort films on our franchise pages. Now, films can be sorted by Release Date, Title, Production Budget, Opening Weekend, Domestic Box Office, and Worldwide Box Office in ascending or descending order.
This makes it easy to see, for example, which Marvel movie had the biggest opening weekend or which Jurassic Park movie had the highest production budget. You can also search and sort all franchises on our main Movie Franchises list.
You can find franchises either by using the Search function from our navigation bar, from our franchise records page, or by clicking on the franchise link on a movie page. By the way, movies can be members of more than one franchise. For example, Avengers: Endgame is a member of both the Avengers franchise, and the Marvel Cinematic Universe.
More...
Weekend Wrap-Up: Spider-Man Hits a Home Run
July 9th, 2019
-2-News.jpg)
Spider-Man: Far From Home really brightened up the box office earning $92.58 million over the three-day weekend for a six-day opening of $185.06 million. This is one of the biggest positive surprises of the year and we desperately needed some good news after June. Toy Story 4 and Aladdin held on better than expected and the overall box office surged growing 21% from last weekend to $183 million. This is still lower than this weekend last year, but by only 2.7% and at this point, I’m willing to call that a victory. Year-to-date, 2019 did manage to close ground with 2018, thanks mostly to Far From Home’s strength before the weekend. However, this year is still 8.4% or $540 million behind last year at $5.88 billion to $6.42 billion.
More...
Weekend Estimates: Toy Story has the Best Opening in the Franchise, Still Disappoints
June 23rd, 2019
-1-News.jpg)
Almost none of the films on this week’s list are living up to expectations, at least not according to the weekend estimates. Toy Story 4 is earning the best opening in the franchise with an estimated $118.0 million weekend. This is third-highest opening for an animated film, so there is reason to celebrate. However, it is also much lower than expected and a little more front-loaded than anticipated, so its future might be in doubt. The film is doing better internationally with an estimated opening weekend of $120.0 million in 37 markets. The film had the third biggest opening in Mexico with $23.4 million, putting it behind just the two most recent Avengers movies. It had the biggest opening for an animated film in Brazil with $9.6 million. The film was also a monster hit in the U.K. with $15.0 million. On the other hand, it struggled in China with a second-place $13.4 million opening there; however, most animated films struggle in China. Hopefully the film’s reviews and its A from CinemaScore translate into long legs, because 2019 really needs more success stories at the box office.
More...
Note: This list contains actors who appeared in at least two movies in the franchise.
| Person | Nr. of Movies | Role | Franchise Worldwide Box Office | Career Worldwide Box Office | Franchise / Career |
|---|---|---|---|---|---|
| Robert Downey, Jr. | 4 | Tony Stark/Iron Man | $7,747,689,229 | $16,313,844,360 | 47.5% |
| Mark Ruffalo | 4 | Bruce Banner / The Hulk | $7,747,689,229 | $11,505,906,988 | 67.3% |
| Chris Evans | 4 | Steve Rogers / Captain America | $7,747,689,229 | $13,743,856,621 | 56.4% |
| Chris Hemsworth | 4 | Thor | $7,747,689,229 | $12,443,189,114 | 62.3% |
| Scarlett Johansson | 4 | Natasha Romanoff/Black Widow | $7,747,689,229 | $15,432,591,804 | 50.2% |
| Jeremy Renner | 4 | Clint Barton/Hawkeye | $7,747,689,229 | $11,948,907,155 | 64.8% |
| Paul Bettany | 4 | Vision | $7,747,689,229 | $13,400,021,931 | 57.8% |
| Samuel L. Jackson | 4 | Nick Fury | $7,747,689,229 | $28,078,250,491 | 27.6% |
| Stan Lee | 4 | Military Veteran | $7,747,689,229 | $30,597,863,315 | 25.3% |
| Don Cheadle | 3 | James Rhodes / War Machine | $6,232,589,018 | $12,408,355,780 | 50.2% |
| Anthony Mackie | 3 | Sam Wilson/Falcon | $6,232,589,018 | $10,148,334,437 | 61.4% |
| Elizabeth Olsen | 3 | Wanda Maximoff/Scarlet Witch | $6,232,589,018 | $8,960,313,893 | 69.6% |
| Tom Hiddleston | 3 | Loki | $6,352,372,250 | $9,390,542,248 | 67.6% |
| Gwyneth Paltrow | 3 | Pepper Potts | $6,352,372,250 | $11,875,027,822 | 53.5% |
| Cobie Smulders | 3 | Maria Hill | $4,958,776,944 | $7,820,715,906 | 63.4% |
| Benedict Cumberbatch | 2 | Stephen Strange | $4,837,272,039 | $15,092,016,577 | 32.1% |
| Danai Gurira | 2 | Okoye | $4,837,272,039 | $7,121,509,555 | 67.9% |
| Tom Holland | 2 | Peter Parker/Spider-Man | $4,837,272,039 | $11,179,875,846 | 43.3% |
| Stellan Skarsgård | 2 | Selvig | $2,910,417,190 | $11,324,543,788 | 25.7% |
| Josh Brolin | 2 | Thanos | $4,837,272,039 | $9,489,603,349 | 51.0% |
| Sebastian Stan | 2 | Bucky Barnes/Winter Soldier | $4,837,272,039 | $8,003,239,367 | 60.4% |
| Karen Gillan | 2 | Nebula | $4,837,272,039 | $10,367,576,896 | 46.7% |
| Benedict Wong | 2 | Wong | $4,837,272,039 | $10,976,520,574 | 44.1% |
| Idris Elba | 2 | Heimdall | $3,443,676,733 | $13,333,554,032 | 25.8% |
| Dave Bautista | 2 | Drax the Destroyer | $4,837,272,039 | $10,926,452,975 | 44.3% |
| Chris Pratt | 2 | Peter Quill/Star-Lord | $4,837,272,039 | $15,676,815,022 | 30.9% |
| Bradley Cooper | 2 | Rocket | $4,837,272,039 | $13,018,467,857 | 37.2% |
| Paul Rudd | 2 | Scott Lang/Ant-Man | $4,837,272,039 | $10,935,701,531 | 44.2% |
| Letitia Wright | 2 | Shuri | $4,837,272,039 | $8,260,645,355 | 58.6% |
| Chadwick Boseman | 2 | T'Challa / Black Panther | $4,837,272,039 | $7,677,935,197 | 63.0% |
| Zoe Saldana | 2 | Gamora | $4,837,272,039 | $15,532,007,706 | 31.1% |
| Pom Klementieff | 2 | Mantis | $4,837,272,039 | $8,136,628,331 | 59.5% |
| Hayley Atwell | 2 | Peggy Carter | $4,184,229,264 | $7,211,052,012 | 58.0% |
| Terry Notary | 2 | Groot | $4,837,272,039 | $7,796,641,940 | 62.0% |
| Maximiliano Hernández | 2 | Agent Jasper Sitwell | $4,304,012,496 | $5,576,220,570 | 77.2% |
| Winston Duke | 2 | M’Baku | $4,837,272,039 | $7,284,742,928 | 66.4% |
| Jacob Batalon | 2 | Ned | $4,837,272,039 | $8,873,174,086 | 54.5% |
| William Hurt | 2 | Thaddeus Ross | $4,837,272,039 | $8,888,174,215 | 54.4% |
| Kerry Condon | 2 | F.R.I.D.A.Y. | $4,837,272,039 | $6,336,396,329 | 76.3% |
| Ross Marquand | 2 | Red Skull | $4,837,272,039 | $4,837,303,887 | 100.0% |
Note: This list contains people who contributed to at least two movies in the franchise.
| Person | Nr. of Movies | Technical Role | Franchise Worldwide Box Office | Career Worldwide Box Office | Franchise / Career |
|---|---|---|---|---|---|
| Kevin Feige | 6 | Producer (6) | $7,747,689,229 | $34,662,913,625 | 22.4% |
| Louis D’Esposito | 4 | Executive Producer (4) | $7,747,689,229 | $30,261,189,436 | 25.6% |
| Victoria Alonso | 4 | Executive Producer (4) | $7,747,689,229 | $29,483,823,322 | 26.3% |
| Stan Lee | 4 |
Based on the Marvel Comics by (3) Executive Producer (3) |
$7,747,689,229 | $38,884,663,058 | 19.9% |
| Jeffrey Ford | 4 | Editor (4) | $7,747,689,229 | $13,559,686,043 | 57.1% |
| Dave Jordan | 4 | Music Supervisor (4) | $7,747,689,229 | $26,278,252,843 | 29.5% |
| Sarah Halley Finn | 4 | Casting Director (4) | $7,747,689,229 | $31,075,574,898 | 24.9% |
| Steve Durkee | 4 |
Supervising Music Editor (4) Score Supervisor (2) |
$7,747,689,229 | $20,594,771,440 | 37.6% |
| Robin Buday | 4 | Assistant Editor (4) | $7,747,689,229 | $13,424,335,411 | 57.7% |
| Jon Favreau | 3 | Executive Producer (3) | $6,232,589,018 | $11,947,819,495 | 52.2% |
| Jack Kirby | 3 |
Based on the Marvel Comics by (3) Captain America Created by (1) |
$6,352,372,250 | $12,232,382,620 | 51.9% |
| Mitch Bell | 3 | Co-Producer (3) | $6,232,589,018 | $15,291,447,925 | 40.8% |
| Charles Wood | 3 | Production Designer (3) | $6,232,589,018 | $10,938,009,012 | 57.0% |
| Alan Silvestri | 3 | Composer (3) | $6,352,372,250 | $18,853,853,445 | 33.7% |
| Dan Sudick | 3 |
Special Effects Supervisor (1) Visual Effects Supervisor (1) Visual Effects Designer (1) |
$6,352,372,250 | $13,029,777,139 | 48.8% |
| Nashia Wachsman | 3 | Music Editor (3) | $6,232,589,018 | $12,094,901,873 | 51.5% |
| Joe Russo | 2 | Director (2) | $4,837,272,039 | $6,991,742,305 | 69.2% |
| Joss Whedon | 2 |
Director (2) Screenwriter (2) |
$2,910,417,190 | $3,628,086,898 | 80.2% |
| Anthony Russo | 2 | Director (2) | $4,837,272,039 | $6,991,742,305 | 69.2% |
| Christopher Markus | 2 |
Screenwriter (2) Co-Producer (1) |
$4,837,272,039 | $9,358,628,734 | 51.7% |
| Stephen McFeely | 2 |
Screenwriter (2) Co-Producer (1) |
$4,837,272,039 | $9,358,628,734 | 51.7% |
| Jeremy Latcham | 2 | Executive Producer (2) | $2,910,417,190 | $5,419,761,154 | 53.7% |
| Michael Grillo | 2 | Executive Producer (2) | $4,837,272,039 | $7,140,524,881 | 67.7% |
| Trinh Tran | 2 | Executive Producer (2) | $4,837,272,039 | $5,989,171,625 | 80.8% |
| James Gunn | 2 | Executive Producer (2) | $4,837,272,039 | $8,036,625,643 | 60.2% |
| Patricia Whitcher | 2 |
Executive Producer (2) Unit Production Manager (1) |
$2,910,417,190 | $8,356,429,873 | 34.8% |
| Lisa Lassek | 2 | Editor (2) | $2,910,417,190 | $3,776,158,338 | 77.1% |
| Trent Opaloch | 2 | Director of Photography (2) | $4,837,272,039 | $7,307,221,092 | 66.2% |
| Matthew Schmidt | 2 | Editor (2) | $4,837,272,039 | $7,129,850,837 | 67.8% |
| Judianna Makovsky | 2 | Costume Designer (2) | $4,837,272,039 | $12,175,882,332 | 39.7% |
| Dan DeLeeuw | 2 | Visual Effects Supervisor (2) | $4,837,272,039 | $7,464,028,491 | 64.8% |
| Chris Castaldi | 2 | First Assistant Director (2) | $4,837,272,039 | $15,554,193,537 | 31.1% |
| Janek Sirrs | 2 | Visual Effects Supervisor (2) | $2,910,417,190 | $6,990,360,258 | 41.6% |
| Shannon Mills | 2 |
Supervising Sound Editor (2) Sound Designer (1) |
$4,837,272,039 | $25,934,583,203 | 18.7% |
| Tom Johnson | 2 | Re-recording Mixer (2) | $4,837,272,039 | $22,437,621,122 | 21.6% |
| John Mahaffie | 2 | Second Unit Director (2) | $2,910,417,190 | $8,469,858,389 | 34.4% |
| Juan Peralta | 2 | Re-recording Mixer (2) | $4,837,272,039 | $16,544,812,679 | 29.2% |
| Daniel Laurie | 2 | Supervising Sound Editor (2) | $4,837,272,039 | $11,455,185,301 | 42.2% |
| Brian Stultz | 2 | Art Director (2) | $4,837,272,039 | $11,990,331,063 | 40.3% |
| Josh Gold | 2 | Sound Effects Editor (2) | $4,837,272,039 | $21,367,424,145 | 22.6% |
| Jacob Riehle | 2 |
Foley Editor (1) Dialogue Editor (1) |
$4,837,272,039 | $22,655,952,894 | 21.4% |
| Steve Orlando | 2 | Sound Effects Editor (2) | $4,837,272,039 | $16,904,403,135 | 28.6% |
| Brad Semenoff | 2 | Dialogue/ADR Editor (2) | $4,837,272,039 | $15,824,934,342 | 30.6% |
| Russell Earl | 2 |
Visual Effects Supervisor (1) Visual Effects Designer (1) |
$4,837,272,039 | $5,809,646,673 | 83.3% |
| Bria Kinter | 2 | Set Designer (2) | $4,837,272,039 | $10,030,055,398 | 48.2% |
| Kelly Port | 2 | Visual Effects Supervisor (2) | $4,837,272,039 | $10,990,624,150 | 44.0% |
| Nia Hansen | 2 | Sound Designer (2) | $4,837,272,039 | $12,486,380,056 | 38.7% |
| Samson Neslund | 2 | Sound Effects Editor (2) | $4,837,272,039 | $8,723,887,969 | 55.4% |