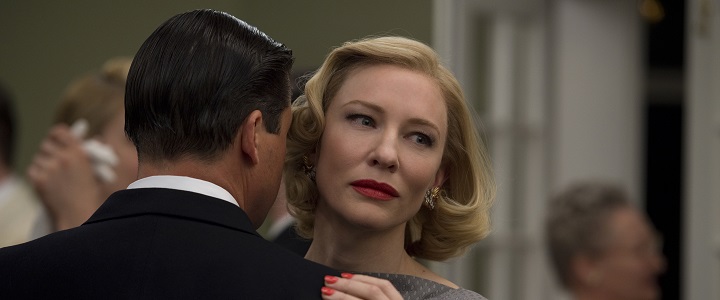
Prem Ratan Dhan Payo (2015)

Prem Ratan Dhan Payo poster
Theatrical Performance
Domestic Box Office $4,364,639Details
International Box Office $43,400,000Details
Worldwide Box Office $47,764,639
Further financial details...

Metrics

Opening Weekend:$2,425,585 (55.6% of total gross)
Legs:1.80 (domestic box office/biggest weekend)
Domestic Share:9.1% (domestic box office/worldwide)
Theater counts:287 opening theaters/287 max. theaters, 2.3 weeks average run per theater
Infl. Adj. Dom. BO $5,581,356

Latest Ranking on Cumulative Box Office Lists

See the Box Office tab (Domestic) and International tab (International and Worldwide) for more Cumulative Box Office Records.


Watch Now On

iTunes:iTunes
Netflix:Netflix, Netflix

Movie Details

Domestic Releases: November 12th, 2015 (Limited) by Fox International
International Releases: November 12th, 2015 (Wide) (Bahrain)
November 12th, 2015 (Wide) (Germany)
November 12th, 2015 (Wide) (Kuwait)
November 12th, 2015 (Wide) (Oman)
November 12th, 2015 (Wide) (United Arab Emirates)
... Show all releases
Video Release: March 1st, 2016 by Netflix
MPAA Rating: Not Rated
Running Time: 164 minutes
Comparisons: vs. Bajrangi Bhaijaan
Create your own comparison chart…
Keywords: Royalty, False Identity, Cross-Dressing, Theater Actor, Romance, Romantic Drama, Political Assassination, Doppelganger
Source:Original Screenplay
Genre:Drama
Production Method:Live Action
Creative Type:Contemporary Fiction
Production/Financing Companies: Rajshri Productions
Production Countries: India
Languages: Hindi

Ranking on other Records and Milestones

RecordRankAmountChart
Date
Days In
Release
Biggest Opening Weekend Limited Release 40 $2,425,585 Nov 13, 2015 4
Veterans Day (Opening, 3-Day) 85 $2,425,585 Nov 13, 2015 4
Veterans Day (Opening, 3-Day, Inflation Adjusted) 98 $3,096,070 Nov 13, 2015 4

Compare this performance with other movies…

Domestic Cumulative Box Office Records

Weekend Box Office Performance

DateRankGross% ChangeTheatersPer TheaterTotal GrossWeek
Nov 13, 2015 8 $2,425,585   287 $8,452   $2,813,018 1
Nov 20, 2015 14 $628,715 -74% 283 $2,222   $3,961,221 2
Nov 27, 2015 28 $140,259 -78% 98 $1,431   $4,328,805 3

Daily Box Office Performance

DateRankGross%YD%LWTheatersPer TheaterTotal GrossDays
Nov 12, 2015 5 $387,433     284 $1,364   $387,433 1
Nov 13, 2015 8 $694,461 +79%   287 $2,420   $1,081,894 2
Nov 14, 2015 9 $986,239 +42%   287 $3,436   $2,068,133 3
Nov 15, 2015 8 $744,885 -24%   287 $2,595   $2,813,018 4
Nov 16, 2015 8 $140,070 -81%   287 $488   $2,953,088 5
Nov 17, 2015 8 $205,703 +47%   287 $717   $3,158,791 6
Nov 18, 2015 11 $105,305 -49%   287 $367   $3,264,096 7
Nov 19, 2015 13 $68,410 -35% -82% 287 $238   $3,332,506 8
Nov 20, 2015 13 $160,474 +135% -77% 283 $567   $3,492,980 9
Nov 21, 2015 14 $266,602 +66% -73% 283 $942   $3,759,582 10
Nov 22, 2015 14 $201,639 -24% -73% 283 $713   $3,961,221 11

Weekly Box Office Performance

DateRankGross% ChangeTheatersPer TheaterTotal GrossWeek
Nov 6, 2015 24 $387,433   284 $1,364   $387,433 1
Nov 13, 2015 8 $2,945,073 +660% 287 $10,262   $3,332,506 2
Nov 20, 2015 17 $856,040 -71% 113 $7,576   $4,188,546 3
Nov 27, 2015 28 $176,093 -79% 113 $1,558   $4,364,639 4

Box Office Summary Per Territory

Territory Release
Date
Opening
Weekend
Opening
Weekend
Screens
Maximum
Screens
Theatrical
Engagements
Total
Box Office
Report
Date
Australia 11/13/2015 $431,607 36 36 80 $659,098 12/14/2015
Austria 11/13/2015 $8,687 2 2 5 $13,421 12/1/2015
Bahrain 11/12/2015 $0 0 3 5 $268,567 12/30/2018
Belgium 11/18/2015 $0 0 3 3 $11,251 12/1/2015
Germany 11/12/2015 $72,856 33 33 49 $107,782 11/25/2015
Iraq 11/19/2015 $0 0 1 2 $4,034 12/30/2018
Kuwait 11/12/2015 $0 0 7 13 $441,059 12/30/2018
New Zealand 11/13/2015 $235,094 26 27 80 $422,170 12/14/2015
Oman 11/12/2015 $14,193 1 6 9 $336,930 12/30/2018
United Arab Emirates 11/12/2015 $1,495,833 79 79 136 $2,286,476 12/30/2018
United Kingdom 11/13/2015 $1,386,984 140 140 415 $2,181,861 6/9/2016
 
Rest of World $36,667,351
 
International Total$43,400,000 12/30/2018

International Cumulative Box Office Records


Worldwide Cumulative Box Office Records


Full financial estimates for this film, including domestic and international box office, video sales, video rentals, TV and ancillary revenue are available through our research services. For more information, please contact us at research@the-numbers.com.

Leading Cast

Salman Khan Prem/Vijay
Sonam Kapoor Maithili

Supporting Cast

Neil Nitin Mukesh Niranjan
Anupam Kher Diwan
Deepak Dobriyal Kanhaiya
Swara Bhaskar Prem’s Sister
Samaira Rao Sameera
Armaan Kohli Chiraj
Aashika Bhatia Prem's Sister
Sanjay Mishra Chaubey Ji

For a description of the different acting role types we use to categorize acting perfomances, see our Glossary.

Production and Technical Credits

Sooraj R. Barjatya Director
Sooraj R. Barjatya Screenwriter
Sooraj R. Barjatya Story by
Ajit Kumar Barjatya Producer
Kamal Kumar Barjatya Producer
Rajkumar Barjatya Producer
Sanjay Sankla Editor
Sanjoy Chowdhury Composer
Himesh Reshammiya Composer
V. Manikandan Cinematographer
Radhika Rao Choreography

The bold credits above the line are the "above-the-line" credits, the other the "below-the-line" credits.

Per Theater Chart: Carol's Second Verse is the Same as the First

December 1st, 2015

Carol

Carol remained in first place on the per theater chart with an average of $49,443 in four theaters. This is 22% lower than the film's opening weekend average, which isn't bad for a limited release. The Danish Girl opened in a close second place with $46,830, also in four theaters. The Hunger Games: Mockingjay - Part 2 earned first place on the overall chart and third place on the per theater chart with an average of $12,456. Janis: Little Girl Blue earned an average of $10,931 in two theaters, which is great for a documentary. The second wide release in the $10,000 club was The Good Dinosaur with an average of $10,444. More...

International Box Office: Hunger Nearly Cracks Quarter Billion

November 25th, 2015

The Hunger Games: Mockingjay - Part 2

The Hunger Games: Mockingjay - Part 2 easily won the box office race on the international chart with $146.0 million in 87 markets for a worldwide opening of $248.7 million. Its biggest market was China, but it only managed third place there with $16.11 million. The film cracked $10 million in the U.K. with $14.10 million in 941 theaters and in Germany with $13.42 million on 1,002. The film's openings were lower than Part 1 managed in most markets (Germany and Latin American seem to be the biggest exceptions) but it is still doing well enough that it will break even before it reaches the home market. More...

Per Theater Chart: Carol Sings a Joyful Tune

November 24th, 2015

Carol

Carol had a festive opening earning just over $250,000 in four theaters for an average of $63,378. That's the third best average for an opening this year, just ahead of Ex Machina and just behind Sicario. The overall box office leader, The Hunger Games: Mockingjay - Part 2, was next with an average of $24,591. Legend was next with an average of $21,709 in four theaters. That's a good start, but its reviews suggest not so good legs. Speaking of long legs, Brooklyn remained in the $10,000 for the third week in a row earning an average of $10,270 in just over 100 theaters. More...

International Box Office: Another Week, Another Milestone for Spectre

November 19th, 2015

Spectre

Spectre again dominated the international box office earning $152.6 million in 92 markets for totals of $413.1 million internationally and $542.1 million worldwide. $500 million worldwide is enough to save face, but the film will need reach at least $600 million worldwide to have a shot at breaking even any time soon. It will likely need $700 million to $800 million to keep the studio happy. Fortunately, that seems very likely. The past weekend, the film opened in first place in China with $48.55 million. It also remained in top spot in the U.K. with $11.96 million in 617 theaters over the weekend for a three-week total of $118.39 million. It is now the fourth biggest hit in that market, while it has a shot at overtaking Skyfall for first place. It will need help from the holidays to get there. Will the movie still be in theaters come New Year's Day? Maybe. More...

Per Theater Chart: James Can't Take the Spotlight

November 17th, 2015

James White

There was only one new release in the $10,000 club and it had to settle for third place on the per theater chart. This left Spotlight in first place with an average of $22,561 in 60 theaters. This is a great result for a film expanding from five to 60 theaters. Brooklyn also expanded, going from five theaters to 23 theaters, while its per theater average remained strong with an average of $20,868. James White was the only new release in the $10,000 club debuting with $12,007 in its lone theater. More...

Weekend Wrap-Up: New Releases feel Unloved

November 17th, 2015

Love the Coopers

There's not much in the way of good news to talk about, which is something that is becoming sadly common. Two of the three new releases missed expectations and expectations were low to begin with. Love the Coopers led the new releases, but it is hardly what you would call a box office hit. Even calling it a middling hit is overstating things. The 33 barely managed a spot in the top five and will quickly leave theaters. My All-American missed the Mendoza Line* by a mile and missed the top ten in the process. This meant Spectre and The Peanuts Movie remained on top of the charts, but they could only help the box office avoid becoming a disaster. As it is, the overall box office fell 33% from last weekend to just $108 million. This was 23% less than the same weekend last year. Year-to-date, 2015's lead over 2015 took a real hit and its down to 3.9% at $9.06 billion to $8.72 billion. However, as we've seen recently, the overall box office is weaker than the these numbers look, as we've seen few major hits and many, many bombs. More...

Weekend Estimates: Spectre Set to Be Number Two Bond

November 15th, 2015

Spectre

Sony are predicting a decline of just 50% for Spectre in its second weekend in theaters, putting James Bond’s latest incarnation on track for a final domestic box office in the neighborhood of $200 million. While well short of Skyfall’s $304 million, it welcome news for a film that’s probably right on the bubble as far as profitability is concerned. More...

Friday Estimates: Openers Fall Well Short of Spectre and Peanuts

November 14th, 2015

Spectre

Three new wide releases are all, as expected, struggling to make much headway against Spectre and The Peanuts Movie this weekend, with the two returning films sitting comfortably at the top of the chart. Spectre picked up an estimated $10.2 million on Friday for a total to date of $105.5 million, while Peanuts earned another $5.6 million, for $63.9 million so far. More...


  1. Summary
  2. News
  3. Box Office
  4. International
  5. Video Sales
  6. Full Financials
  7. Cast & Crew
  8. Trailer

Metrics

Opening Weekend:$2,425,585 (55.6% of total gross)
Legs:1.80 (domestic box office/biggest weekend)
Domestic Share:9.1% (domestic box office/worldwide)
Theater counts:287 opening theaters/287 max. theaters, 2.3 weeks average run per theater
Infl. Adj. Dom. BO $5,581,356

Latest Ranking on Cumulative Box Office Lists

See the Box Office tab (Domestic) and International tab (International and Worldwide) for more Cumulative Box Office Records.


Watch Now On

iTunes:iTunes
Netflix:Netflix, Netflix

Movie Details

Domestic Releases: November 12th, 2015 (Limited) by Fox International
International Releases: November 12th, 2015 (Wide) (Bahrain)
November 12th, 2015 (Wide) (Germany)
November 12th, 2015 (Wide) (Kuwait)
November 12th, 2015 (Wide) (Oman)
November 12th, 2015 (Wide) (United Arab Emirates)
... Show all releases
Video Release: March 1st, 2016 by Netflix
MPAA Rating: Not Rated
Running Time: 164 minutes
Comparisons: vs. Bajrangi Bhaijaan
Create your own comparison chart…
Keywords: Royalty, False Identity, Cross-Dressing, Theater Actor, Romance, Romantic Drama, Political Assassination, Doppelganger
Source:Original Screenplay
Genre:Drama
Production Method:Live Action
Creative Type:Contemporary Fiction
Production/Financing Companies: Rajshri Productions
Production Countries: India
Languages: Hindi

Ranking on other Records and Milestones

RecordRankAmountChart
Date
Days In
Release
Biggest Opening Weekend Limited Release 40 $2,425,585 Nov 13, 2015 4
Veterans Day (Opening, 3-Day) 85 $2,425,585 Nov 13, 2015 4
Veterans Day (Opening, 3-Day, Inflation Adjusted) 98 $3,096,070 Nov 13, 2015 4

Leading Cast

Salman Khan Prem/Vijay
Sonam Kapoor Maithili

Supporting Cast

Neil Nitin Mukesh Niranjan
Anupam Kher Diwan
Deepak Dobriyal Kanhaiya
Swara Bhaskar Prem’s Sister
Samaira Rao Sameera
Armaan Kohli Chiraj
Aashika Bhatia Prem's Sister
Sanjay Mishra Chaubey Ji

For a description of the different acting role types we use to categorize acting perfomances, see our Glossary.

Production and Technical Credits

Sooraj R. Barjatya Director
Sooraj R. Barjatya Screenwriter
Sooraj R. Barjatya Story by
Ajit Kumar Barjatya Producer
Kamal Kumar Barjatya Producer
Rajkumar Barjatya Producer
Sanjay Sankla Editor
Sanjoy Chowdhury Composer
Himesh Reshammiya Composer
V. Manikandan Cinematographer
Radhika Rao Choreography

The bold credits above the line are the "above-the-line" credits, the other the "below-the-line" credits.

Per Theater Chart: Carol's Second Verse is the Same as the First

December 1st, 2015

Carol

Carol remained in first place on the per theater chart with an average of $49,443 in four theaters. This is 22% lower than the film's opening weekend average, which isn't bad for a limited release. The Danish Girl opened in a close second place with $46,830, also in four theaters. The Hunger Games: Mockingjay - Part 2 earned first place on the overall chart and third place on the per theater chart with an average of $12,456. Janis: Little Girl Blue earned an average of $10,931 in two theaters, which is great for a documentary. The second wide release in the $10,000 club was The Good Dinosaur with an average of $10,444. More...

International Box Office: Hunger Nearly Cracks Quarter Billion

November 25th, 2015

The Hunger Games: Mockingjay - Part 2

The Hunger Games: Mockingjay - Part 2 easily won the box office race on the international chart with $146.0 million in 87 markets for a worldwide opening of $248.7 million. Its biggest market was China, but it only managed third place there with $16.11 million. The film cracked $10 million in the U.K. with $14.10 million in 941 theaters and in Germany with $13.42 million on 1,002. The film's openings were lower than Part 1 managed in most markets (Germany and Latin American seem to be the biggest exceptions) but it is still doing well enough that it will break even before it reaches the home market. More...

Per Theater Chart: Carol Sings a Joyful Tune

November 24th, 2015

Carol

Carol had a festive opening earning just over $250,000 in four theaters for an average of $63,378. That's the third best average for an opening this year, just ahead of Ex Machina and just behind Sicario. The overall box office leader, The Hunger Games: Mockingjay - Part 2, was next with an average of $24,591. Legend was next with an average of $21,709 in four theaters. That's a good start, but its reviews suggest not so good legs. Speaking of long legs, Brooklyn remained in the $10,000 for the third week in a row earning an average of $10,270 in just over 100 theaters. More...

International Box Office: Another Week, Another Milestone for Spectre

November 19th, 2015

Spectre

Spectre again dominated the international box office earning $152.6 million in 92 markets for totals of $413.1 million internationally and $542.1 million worldwide. $500 million worldwide is enough to save face, but the film will need reach at least $600 million worldwide to have a shot at breaking even any time soon. It will likely need $700 million to $800 million to keep the studio happy. Fortunately, that seems very likely. The past weekend, the film opened in first place in China with $48.55 million. It also remained in top spot in the U.K. with $11.96 million in 617 theaters over the weekend for a three-week total of $118.39 million. It is now the fourth biggest hit in that market, while it has a shot at overtaking Skyfall for first place. It will need help from the holidays to get there. Will the movie still be in theaters come New Year's Day? Maybe. More...

Per Theater Chart: James Can't Take the Spotlight

November 17th, 2015

James White

There was only one new release in the $10,000 club and it had to settle for third place on the per theater chart. This left Spotlight in first place with an average of $22,561 in 60 theaters. This is a great result for a film expanding from five to 60 theaters. Brooklyn also expanded, going from five theaters to 23 theaters, while its per theater average remained strong with an average of $20,868. James White was the only new release in the $10,000 club debuting with $12,007 in its lone theater. More...

Weekend Wrap-Up: New Releases feel Unloved

November 17th, 2015

Love the Coopers

There's not much in the way of good news to talk about, which is something that is becoming sadly common. Two of the three new releases missed expectations and expectations were low to begin with. Love the Coopers led the new releases, but it is hardly what you would call a box office hit. Even calling it a middling hit is overstating things. The 33 barely managed a spot in the top five and will quickly leave theaters. My All-American missed the Mendoza Line* by a mile and missed the top ten in the process. This meant Spectre and The Peanuts Movie remained on top of the charts, but they could only help the box office avoid becoming a disaster. As it is, the overall box office fell 33% from last weekend to just $108 million. This was 23% less than the same weekend last year. Year-to-date, 2015's lead over 2015 took a real hit and its down to 3.9% at $9.06 billion to $8.72 billion. However, as we've seen recently, the overall box office is weaker than the these numbers look, as we've seen few major hits and many, many bombs. More...

Weekend Estimates: Spectre Set to Be Number Two Bond

November 15th, 2015

Spectre

Sony are predicting a decline of just 50% for Spectre in its second weekend in theaters, putting James Bond’s latest incarnation on track for a final domestic box office in the neighborhood of $200 million. While well short of Skyfall’s $304 million, it welcome news for a film that’s probably right on the bubble as far as profitability is concerned. More...

Friday Estimates: Openers Fall Well Short of Spectre and Peanuts

November 14th, 2015

Spectre

Three new wide releases are all, as expected, struggling to make much headway against Spectre and The Peanuts Movie this weekend, with the two returning films sitting comfortably at the top of the chart. Spectre picked up an estimated $10.2 million on Friday for a total to date of $105.5 million, while Peanuts earned another $5.6 million, for $63.9 million so far. More...

Compare this performance with other movies…

Domestic Cumulative Box Office Records

Weekend Box Office Performance

DateRankGross% ChangeTheatersPer TheaterTotal GrossWeek
Nov 13, 2015 8 $2,425,585   287 $8,452   $2,813,018 1
Nov 20, 2015 14 $628,715 -74% 283 $2,222   $3,961,221 2
Nov 27, 2015 28 $140,259 -78% 98 $1,431   $4,328,805 3

Daily Box Office Performance

DateRankGross%YD%LWTheatersPer TheaterTotal GrossDays
Nov 12, 2015 5 $387,433     284 $1,364   $387,433 1
Nov 13, 2015 8 $694,461 +79%   287 $2,420   $1,081,894 2
Nov 14, 2015 9 $986,239 +42%   287 $3,436   $2,068,133 3
Nov 15, 2015 8 $744,885 -24%   287 $2,595   $2,813,018 4
Nov 16, 2015 8 $140,070 -81%   287 $488   $2,953,088 5
Nov 17, 2015 8 $205,703 +47%   287 $717   $3,158,791 6
Nov 18, 2015 11 $105,305 -49%   287 $367   $3,264,096 7
Nov 19, 2015 13 $68,410 -35% -82% 287 $238   $3,332,506 8
Nov 20, 2015 13 $160,474 +135% -77% 283 $567   $3,492,980 9
Nov 21, 2015 14 $266,602 +66% -73% 283 $942   $3,759,582 10
Nov 22, 2015 14 $201,639 -24% -73% 283 $713   $3,961,221 11

Weekly Box Office Performance

DateRankGross% ChangeTheatersPer TheaterTotal GrossWeek
Nov 6, 2015 24 $387,433   284 $1,364   $387,433 1
Nov 13, 2015 8 $2,945,073 +660% 287 $10,262   $3,332,506 2
Nov 20, 2015 17 $856,040 -71% 113 $7,576   $4,188,546 3
Nov 27, 2015 28 $176,093 -79% 113 $1,558   $4,364,639 4

Box Office Summary Per Territory

Territory Release
Date
Opening
Weekend
Opening
Weekend
Screens
Maximum
Screens
Theatrical
Engagements
Total
Box Office
Report
Date
Australia 11/13/2015 $431,607 36 36 80 $659,098 12/14/2015
Austria 11/13/2015 $8,687 2 2 5 $13,421 12/1/2015
Bahrain 11/12/2015 $0 0 3 5 $268,567 12/30/2018
Belgium 11/18/2015 $0 0 3 3 $11,251 12/1/2015
Germany 11/12/2015 $72,856 33 33 49 $107,782 11/25/2015
Iraq 11/19/2015 $0 0 1 2 $4,034 12/30/2018
Kuwait 11/12/2015 $0 0 7 13 $441,059 12/30/2018
New Zealand 11/13/2015 $235,094 26 27 80 $422,170 12/14/2015
Oman 11/12/2015 $14,193 1 6 9 $336,930 12/30/2018
United Arab Emirates 11/12/2015 $1,495,833 79 79 136 $2,286,476 12/30/2018
United Kingdom 11/13/2015 $1,386,984 140 140 415 $2,181,861 6/9/2016
 
Rest of World $36,667,351
 
International Total$43,400,000 12/30/2018

International Cumulative Box Office Records


Worldwide Cumulative Box Office Records


Full financial estimates for this film, including domestic and international box office, video sales, video rentals, TV and ancillary revenue are available through our research services. For more information, please contact us at research@the-numbers.com.