Box Office History for SpongeBob SquarePants Movies
Register with The Numbers for free to customize this chart.
| Release Date | Title | Production Budget | Opening Weekend | Domestic Box Office | Worldwide Box Office |
|---|---|---|---|---|---|
| Dec 19, 2025 | The SpongeBob Movie: Search… | ||||
| Aug 14, 2020 | The SpongeBob Movie: Sponge… | $60,000,000 | $865,824 | $4,810,790 | $4,810,790 |
| Feb 6, 2015 | The SpongeBob Movie: Sponge… | $74,000,000 | $55,365,012 | $162,994,032 | $311,013,181 |
| Nov 19, 2004 | SpongeBob SquarePants: The … | $30,000,000 | $32,018,216 | $85,416,609 | $142,051,255 |
| Averages | $54,666,667 | $29,416,351 | $84,407,144 | $152,625,075 | |
| Totals | 4 | $164,000,000 | $253,221,431 | $457,875,226 | |
Video Release Breakdown
| Release Date | Title | Domestic Video Sales to Date | Watch Now |
|---|---|---|---|
| Oct 19, 2004 | SpongeBob SquarePants: The Complete Second… | ||
| Sep 27, 2005 | SpongeBob SquarePants: Season 3 | ||
| Mar 1, 2014 | SpongeBob SquarePants: The Movie | Amazon Google | |
| Jun 2, 2015 | The SpongeBob Movie: Sponge Out of Water | $24,792,031 | Amazon iTunes Google Vudu |
| Jun 7, 2016 | The Spongebob Movie Collection | $423,219 | |
| May 23, 2017 | SpongeBob SquarePants First 100 Episodes | ||
| Oct 10, 2017 | SpongeBob SquarePants: Season 9 | $251,607 | Amazon |
| Sep 11, 2018 | SpongeBob SquarePants: The Legend of Boo-K… | $7,418 | |
| Jul 15, 2019 | SpongeBob SquarePants: The Best 200 Episod… | ||
| Oct 15, 2019 | SpongeBob SquarePants: Season 10 | Amazon | |
| Mar 31, 2020 | SpongeBob SquarePants: The Complete Eleven… | $197,212 | Amazon |
| Apr 28, 2020 | SpongeBob SquarePants: Bikini Bottom Bash | ||
| Jan 12, 2021 | SpongeBob SquarePants: Season 12 | $172,659 | |
| Mar 4, 2021 | The SpongeBob Movie: Sponge on the Run | $2,872,391 | iTunes Google Vudu |
| Jul 9, 2021 | The Patrick Star Show | ||
| Jul 13, 2021 | The SpongeBob 3-Movie Collection | $38,272 | |
| Dec 5, 2023 | Kamp Koral: SpongeBob's Under Years - Seas… | ||
| Dec 5, 2023 | The Patrick Star Show: Season 1, Volume 2 | ||
| Totals | $28,754,809 | ||
Our DVD and Blu-ray sales estimates are based on weekly retail surveys, which we use to build a weekly market share estimate for each title we are tracking. The market share is converted into a weekly sales estimate based on industry reports on the overall size of the market, including reports published in Media Play News.
For example, if our weekly retail survey estimates that a particular title sold 1% of all units that week, and the industry reports sales of 1,500,000 units in total, we will estimate 15,000 units were sold of that title. The consumer spending estimate is based on the average sales price for the title in the retailers we survey.
We refine our estimates from week to week as more data becomes available. In particular, we adjust weekly sales figures for the quarter once the total market estimates are published by the Digital Entertainment Group. Figures will therefore fluctuate each week, and totals for individual titles can go up or down as we update our estimates.
Because sales figures are estimated based on sampling, they will be more accurate for higher-selling titles.
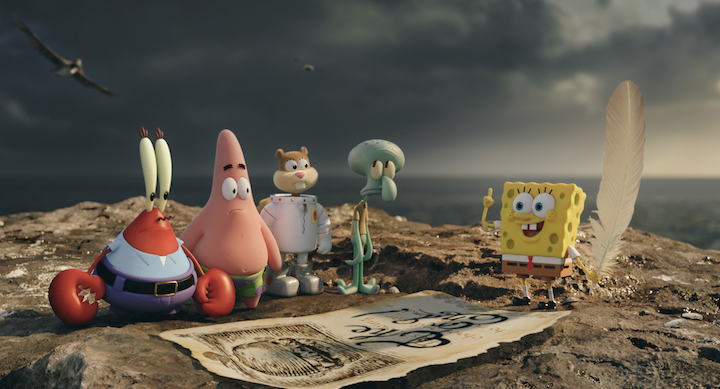
Weekend Wrap-Up: SpongeBob and Unhinged Kick Off the Theatrical Comeback
August 18th, 2020
-2-News.jpg)
The release of two major new movies in Canada at the weekend gave us a first chance to see how the box office might recover in North America as theaters open up. The results are not particularly encouraging, although they are in line with our analysis earlier this month.
More...
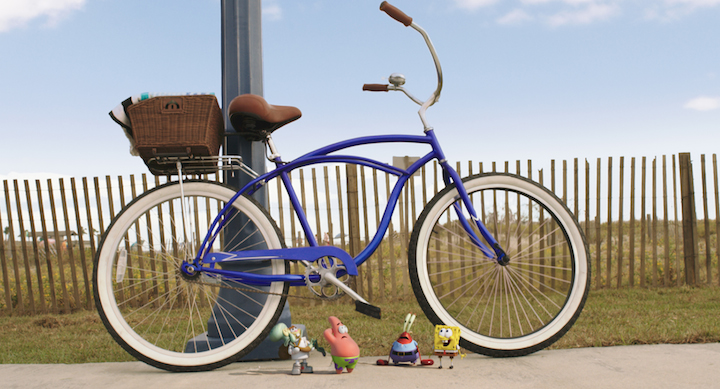
Weekend Preview: SpongeBob Ready to Run Away with the Box Office
August 13th, 2020
-1-News.jpg)
For the first time in a long, long time there are wide releases to talk about. That is, two films are opening wide... in Canada: The SpongeBob Movie: Sponge on the Run and Unhinged. While Canada is a lot smaller than the United States, it is still a large enough part of the domestic box office that we should see the best domestic weekend since the pandemic caused theaters to be shut down in March.
More...
2015 - Holiday Gift Guide - Part I
November 27th, 2015

It's Thanksgiving weekend, which means Black Friday, Cyber Monday, and of course the first installment of our Holiday Gift Guide. This week we will tackle first run releases, as well as franchise box sets. I'm going to try to keep it to a dozen or so releases, as these columns are notorious for getting out of hand. Also, while there were a record number of $1 billion box office hits, there were not as many first run releases that earned stellar reviews this year.
More...
Home Market Numbers: Kings Among Men
July 4th, 2015

It was a busy week in real life, with the July Preview, Canada Day, and July 4th holidays messing with schedules. Because of that, the home market numbers were late this week. However, this week's numbers will be up in the next two days, so it was a very short disruption. That said, there's not much to talk about when it comes to new releases on the home video sales charts for the week ending June 14. Sure, The Kingsman: Secret Service earned first place on the home market chart, but there was only one other new release in the top five and only a few others in the top 30. The number one release of the week sold 591,000 units and generated $10.29 million in consumer spending. This includes an opening week Blu-ray share of 51%. Anything above 50% is worth celebrating; however, the overall numbers are still lower than anticipated.
More...
Home Market Releases for June 2nd, 2015
June 3rd, 2015
Welcome to the column formerly known as the DVD and Blu-ray release report! In response to the changing home market landscape, we have renamed it the Home Market Release Report, and will now be including Video-on-Demand releases. It was a bad week to try and change the format, as there were a ton of great releases contending for Pick of the Week. Most of these contenders are TV on DVD releases, including Parks & Recreation: Season 7. There is also one limited release, Spring on Blu-ray, and one first-run releases, The SpongeBob Movie: A Sponge Out of Water on 3D Combo Pack. It was a close race, but I choose SpongeBob in the end.
More...
Featured Blu-ray / DVD Review: The Spongebob Movie: Sponge Out of Water
June 1st, 2015
On Friday, I got a package of half-a-dozen Nickelodeon releases ... all of which come out on Tuesday. Needless to say, I won't be reviewing all of them, but that's why the current box office prediction contest features Nickelodeon releases. The one I'm definitely reviewing is The SpongeBob Movie: A Sponge Out of Water, which earned great reviews and was a surprise hit at the box office. Did it deserve this success? Or will I be one of the dissenting voices?
More...
Weekend Wrap-Up: Box Office Loses Focus
March 3rd, 2015
-Thumbnail.jpg)
As expected, Focus led the way at the box office, but sadly did so with a much lower opening weekend result than predicted. The rest of the top five were a little stronger than predicted each earning between $10 million and $12 million. That said, the overall box office was still weak, down 10% from last week to $107 million. It was also down 13% from last year. This caused 2015's lead over 2014 to drop. Granted, 2015 is still ahead of 2014 by $110 million or 6.8% at $1.74 billion to $1.63 billion, so it would take a while to lose that lead at this pace.
More...
Note: This list contains actors who appeared in at least two movies in the franchise.
| Person | Nr. of Movies | Role | Franchise Worldwide Box Office | Career Worldwide Box Office | Franchise / Career |
|---|---|---|---|---|---|
| Tom Kenny | 3 | SpongeBob SquarePants/Narrator/Gary/Clay/Tough Fish/Twin/Houston | $457,875,226 | $1,309,173,105 | 35.0% |
| Bill Fagerbakke | 3 | Patrick Star/Fish/Chum Customer/Local Fish | $457,875,226 | $457,875,226 | 100.0% |
| Clancy Brown | 3 | Mr. Krabs | $457,875,226 | $2,798,953,262 | 16.4% |
| Rodger Bumpass | 3 | Squidward Tentacles/Fish | $457,875,226 | $1,371,205,081 | 33.4% |
| Mr. Lawrence | 3 | Plankton/Fish/Attendant (Lloyd) | $457,875,226 | $457,875,226 | 100.0% |
| Carolyn Lawrence | 3 | Sandy Cheeks | $457,875,226 | $556,885,893 | 82.2% |
| Jill Talley | 3 | Karen | $457,875,226 | $471,890,450 | 97.0% |
| Mary Jo Catlett | 3 | Mrs. Puff | $457,875,226 | $457,875,226 | 100.0% |
| Lori Alan | 3 | Pearl | $457,875,226 | $7,130,311,053 | 6.4% |
| Carlos Alazraqui | 2 | Seagull/Dead Parrot | $453,064,436 | $6,531,242,206 | 6.9% |
| Dee Bradley Baker | 2 | Man Cop, Phil, Perch Perkins, Waiter, Attendant, Thug, Coughing Fish, Twin, Frog Fish, Monster, Freed Fish, Sandals | $453,064,436 | $3,789,412,805 | 12.0% |
| Sirena Irwin | 2 | Reporter, Driver, Ice Cream Lady | $453,064,436 | $453,369,839 | 99.9% |
| Stephen Hillenburg | 2 | Voice of Parrot | $453,064,436 | $453,064,436 | 100.0% |
Note: This list contains people who contributed to at least two movies in the franchise.
| Person | Nr. of Movies | Technical Role | Franchise Worldwide Box Office | Career Worldwide Box Office | Franchise / Career |
|---|---|---|---|---|---|
| Stephen Hillenburg | 3 |
Story Creator (3) Executive Producer (2) Director (1) Based on the Series "Spongebob Squarepants" Created By (1) Producer (1) Screenwriter (1) |
$457,875,226 | $457,875,226 | 100.0% |
| Jonathan Aibel | 2 | Screenwriter (2) | $315,823,971 | $4,249,836,246 | 7.4% |
| Tim Hill | 2 |
Screenwriter (2) Director (1) |
$146,862,045 | $1,049,731,611 | 14.0% |
| Glenn Berger | 2 | Screenwriter (2) | $315,823,971 | $4,249,836,246 | 7.4% |
| Derek Drymon | 2 |
Screenwriter (1) Executive Producer (1) Director (1) |
$142,051,255 | $653,896,735 | 21.7% |
| Paul Tibbitt | 2 |
Director (1) Story Creator (1) Producer (1) Screenwriter (1) |
$453,064,436 | $453,064,436 | 100.0% |
| Chris Spellman | 2 |
Production Supervisor (1) Production Designer (1) |
$146,862,045 | $1,475,419,888 | 10.0% |
| Alan Smart | 2 |
Animation Supervisor (1) Supervising Animation Director (1) |
$453,064,436 | $453,064,436 | 100.0% |