Muscle Shoals (2013)

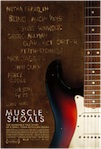
Muscle Shoals poster
Theatrical Performance
Domestic Box Office $696,241Details
Further financial details...

Synopsis

Located alongside the Tennessee River, Muscle Shoals, Alabama is the unlikely breeding ground for some of America's most creative and defiant music. Under the spiritual influence of the "Singing River," as Native Americans called it, the music of Muscle Shoals has helped create some of the most important and resonant songs of all time. At its heart is Rick Hall who founded FAME Studios. Overcoming crushing poverty and staggering tragedies, Hall brought black and white together in Alabama's cauldron of racial hostility to create music for the generations. He is responsible for creating the "Muscle Shoals sound" and The Swampers, the house band at FAME that eventually left to start their own successful studio, known as Muscle Shoals Sound.

Metrics

Opening Weekend:$13,901 (2.0% of total gross)
Legs:7.29 (domestic box office/biggest weekend)
Domestic Share:100.0% (domestic box office/worldwide)
Theater counts:1 opening theaters/56 max. theaters, 6.9 weeks average run per theater
Infl. Adj. Dom. BO $923,016

Latest Ranking on Cumulative Box Office Lists

See the Box Office tab (Domestic) and International tab (International and Worldwide) for more Cumulative Box Office Records.


Watch Now On

Amazon VOD:Amazon
iTunes:iTunes

Movie Details

Domestic Releases: September 27th, 2013 (Limited) by Magnolia Pictures
Video Release: February 25th, 2014 by Magnolia Home Entertainment
MPAA Rating: PG for thematic elements, language, smoking and brief partial nudity.
(Rating bulletin 2286, 8/21/2013)
Running Time: 111 minutes
Comparisons: vs. 20 Feet From Stardom
Create your own comparison chart…
Keywords: Rock 'n' Roll, Rhythm and Blues, Biography, Musicians, Music Industry
Source:Based on Real Life Events
Genre:Documentary
Production Method:Live Action
Creative Type:Factual
Production/Financing Companies: Ear Goggles Productions
Production Countries: United States
Languages: English

Ranking on other Records and Milestones

RecordRankAmountChart
Date
Days In
Release
Top 2013 Theater Average 95 $13,901 Sep 27, 2013 3

Compare this performance with other movies…

Domestic Cumulative Box Office Records

Weekend Box Office Performance

DateRankGross% ChangeTheatersPer TheaterTotal GrossWeek
Sep 27, 2013 60 $13,901   1 $13,901   $13,901 1
Oct 4, 2013 62 $16,723 +20% 4 $4,181   $34,190 2
Oct 11, 2013 45 $50,419 +201% 14 $3,601   $95,235 3
Oct 18, 2013 37 $95,443 +89% 36 $2,651   $219,325 4
Oct 25, 2013 37 $82,966 -13% 56 $1,482   $341,525 5
Nov 1, 2013 36 $57,828 -30% 46 $1,257   $440,596 6
Nov 8, 2013 46 $34,265 -41% 46 $745   $505,223 7
Nov 15, 2013 43 $44,324 +29% 44 $1,007   $568,612 8
Nov 22, 2013 50 $13,780 -69% 25 $551   $607,323 9
Nov 29, 2013 51 $12,847 -7% 29 $443   $634,876 10
Dec 6, 2013 49 $6,562 -49% 13 $505   $647,197 11
Dec 13, 2013 50 $4,120 -37% 11 $375   $656,575 12
Dec 20, 2013 46 $2,306 -44% 9 $256   $663,065 13
Dec 27, 2013 54 $2,448 +6% 7 $350   $666,862 14
Jan 3, 2014 63 $2,188 -11% 5 $438   $671,810 15
Jan 10, 2014 57 $3,567 +63% 5 $713   $677,412 16
Jan 17, 2014 59 $2,336 -35% 11 $212   $681,613 17
Jan 24, 2014 63 $966 -59% 6 $161   $684,906 18
Jan 31, 2014 79 $973 +1% 5 $195   $687,694 19
Feb 7, 2014 77 $426 -56% 2 $213   $689,035 20
Feb 14, 2014 77 $1,164 +173% 3 $388   $690,199 21
Feb 21, 2014 90 $522 -55% 4 $131   $691,324 22
Feb 28, 2014 92 $227 -57% 2 $114   $691,789 23
Mar 7, 2014 93 $1,008 +344% 4 $252   $695,625 24

Daily Box Office Performance

Weekly Box Office Performance

DateRankGross% ChangeTheatersPer TheaterTotal GrossWeek
Sep 27, 2013 60 $17,467   1 $17,467   $17,467 1
Oct 4, 2013 59 $27,349 +57% 4 $6,837   $44,816 2
Oct 11, 2013 44 $79,066 +189% 14 $5,648   $123,882 3
Oct 18, 2013 37 $134,677 +70% 36 $3,741   $258,559 4
Oct 25, 2013 33 $124,209 -8% 56 $2,218   $382,768 5
Nov 1, 2013 32 $88,190 -29% 46 $1,917   $470,958 6
Nov 8, 2013 38 $53,330 -40% 46 $1,159   $524,288 7
Nov 15, 2013 39 $69,255 +30% 48 $1,443   $593,543 8
Nov 22, 2013 47 $28,486 -59% 25 $1,139   $622,029 9
Nov 29, 2013 46 $18,606 -35% 20 $930   $640,635 10
Dec 6, 2013 48 $11,820 -36% 13 $909   $652,455 11
Dec 13, 2013 52 $8,304 -30% 11 $755   $660,759 12
Dec 20, 2013 52 $3,655 -56% 9 $406   $664,414 13
Dec 27, 2013 52 $5,208 +42% 7 $744   $669,622 14
Jan 3, 2014 55 $4,223 -19% 5 $845   $673,845 15
Jan 10, 2014 52 $5,432 +29% 5 $1,086   $679,277 16
Jan 17, 2014 53 $4,663 -14% 11 $424   $683,940 17
Jan 24, 2014 60 $2,781 -40% 6 $464   $686,721 18
Jan 31, 2014 65 $1,888 -32% 5 $378   $688,609 19
Feb 14, 2014 74 $1,767   21 $84   $690,802 21
Feb 21, 2014 87 $760 -57% 5 $152   $691,562 22
Feb 28, 2014 74 $3,055 +302% 21 $145   $694,617 23
Mar 7, 2014 86 $1,624 -47% 4 $406   $696,241 24

Full financial estimates for this film, including domestic and international box office, video sales, video rentals, TV and ancillary revenue are available through our research services. For more information, please contact us at research@the-numbers.com.

Interviewee(s)

Aretha Franklin Herself
Bono Himself
Greg Allman Himself
Clarence Carter Himself
Mick Jagger Himself
Etta James Herself
Alicia Keys Herself
Keith Richards Himself
Percy Sledge Himself
Steve Winwood Himself

For a description of the different acting role types we use to categorize acting perfomances, see our Glossary.

Production and Technical Credits

Greg 'Freedy' Camalier* Director
Anthony Arendt Cinematographer
Richard Lowe Editor
Linda Livingston Associate Producer
Stephen Badger Producer
Greg Camalier Producer
Stephen Badger Executive Producer
Greg Camalier Executive Producer

DVD and Blu-ray Releases for February 25th, 2014

February 24th, 2014

It's a very impressive week at the top of the new DVD and Blu-ray releases. There's not one, but two $200 million hits coming out this week. Likewise, there are not one, but two major Awards Season hits coming out as well. One film, Gravity, is in both groups. All three films, Gravity, Thor: The Dark World, and Nebraska, are all contenders for Pick of the Week. Gravity is the only one I didn't get a chance to review, but the Blu-ray Combo Pack or the 3D Combo Pack are clearly the Pick of the Week. It's an amazing movie and the Blu-ray releases are loaded with extras. More...

Per Theater Chart: Shoals Muscles the Competition

October 2nd, 2013

There were only two films to reach the $10,000 mark on the Per Theater Chart, and they were practically tied. Muscle Shoals led the way with $13,901 in its lone theater, while Atharintiki Daaredi earned an average of $13,393 in 112 theaters. More...

Weekend Estimates: Meatballs Makes Tasty Debut

September 29th, 2013

As expected, Cloudy with a Chance of Meatballs 2 will be the comfortable winner of this weekend's box office race with a healthy $35 million beginning, according to Sony's Sunday estimate. That puts the film on course for the 4th-biggest weekend in September and is about $5 million ahead of the opening for the first film in the franchise. Given hopes of a $40 million debut, the film could be said to have underperformed slightly (and it will almost certainly not top the original's $124.8 million domestic total), but given the timing of the release, the studio will have reason for modest celebration in the midst of their worst year since 2005. The top of the chart in general has a middling-to-good-enough look to it this weekend. More...

Limited Releases Are What They Are

September 27th, 2013

There are a lot of limited releases on this week's list, including a few earning stellar reviews. There are also a few with weak reviews or that are the wrong genre to thrive in limited release. One film fits into both ends of the spectrum, We Are What We Are, which is earning great reviews, but as a horror film, likely won't find an audience till the home market. Hopefully I am wrong. Inequality for All is earning even better reviews, but it is a documentary, so it have very little chance to expand. On the Job has the best reviews of the week, but it is a foreign-language action film, so it will likely not earn breakout success. More...


  1. Summary
  2. News
  3. Box Office
  4. International
  5. Video Sales
  6. Full Financials
  7. Cast & Crew
  8. Trailer

Synopsis

Located alongside the Tennessee River, Muscle Shoals, Alabama is the unlikely breeding ground for some of America's most creative and defiant music. Under the spiritual influence of the "Singing River," as Native Americans called it, the music of Muscle Shoals has helped create some of the most important and resonant songs of all time. At its heart is Rick Hall who founded FAME Studios. Overcoming crushing poverty and staggering tragedies, Hall brought black and white together in Alabama's cauldron of racial hostility to create music for the generations. He is responsible for creating the "Muscle Shoals sound" and The Swampers, the house band at FAME that eventually left to start their own successful studio, known as Muscle Shoals Sound.

Metrics

Opening Weekend:$13,901 (2.0% of total gross)
Legs:7.29 (domestic box office/biggest weekend)
Domestic Share:100.0% (domestic box office/worldwide)
Theater counts:1 opening theaters/56 max. theaters, 6.9 weeks average run per theater
Infl. Adj. Dom. BO $923,016

Latest Ranking on Cumulative Box Office Lists

See the Box Office tab (Domestic) and International tab (International and Worldwide) for more Cumulative Box Office Records.


Watch Now On

Amazon VOD:Amazon
iTunes:iTunes

Movie Details

Domestic Releases: September 27th, 2013 (Limited) by Magnolia Pictures
Video Release: February 25th, 2014 by Magnolia Home Entertainment
MPAA Rating: PG for thematic elements, language, smoking and brief partial nudity.
(Rating bulletin 2286, 8/21/2013)
Running Time: 111 minutes
Comparisons: vs. 20 Feet From Stardom
Create your own comparison chart…
Keywords: Rock 'n' Roll, Rhythm and Blues, Biography, Musicians, Music Industry
Source:Based on Real Life Events
Genre:Documentary
Production Method:Live Action
Creative Type:Factual
Production/Financing Companies: Ear Goggles Productions
Production Countries: United States
Languages: English

Ranking on other Records and Milestones

RecordRankAmountChart
Date
Days In
Release
Top 2013 Theater Average 95 $13,901 Sep 27, 2013 3

Interviewee(s)

Aretha Franklin Herself
Bono Himself
Greg Allman Himself
Clarence Carter Himself
Mick Jagger Himself
Etta James Herself
Alicia Keys Herself
Keith Richards Himself
Percy Sledge Himself
Steve Winwood Himself

For a description of the different acting role types we use to categorize acting perfomances, see our Glossary.

Production and Technical Credits

Greg 'Freedy' Camalier* Director
Anthony Arendt Cinematographer
Richard Lowe Editor
Linda Livingston Associate Producer
Stephen Badger Producer
Greg Camalier Producer
Stephen Badger Executive Producer
Greg Camalier Executive Producer

DVD and Blu-ray Releases for February 25th, 2014

February 24th, 2014

It's a very impressive week at the top of the new DVD and Blu-ray releases. There's not one, but two $200 million hits coming out this week. Likewise, there are not one, but two major Awards Season hits coming out as well. One film, Gravity, is in both groups. All three films, Gravity, Thor: The Dark World, and Nebraska, are all contenders for Pick of the Week. Gravity is the only one I didn't get a chance to review, but the Blu-ray Combo Pack or the 3D Combo Pack are clearly the Pick of the Week. It's an amazing movie and the Blu-ray releases are loaded with extras. More...

Per Theater Chart: Shoals Muscles the Competition

October 2nd, 2013

There were only two films to reach the $10,000 mark on the Per Theater Chart, and they were practically tied. Muscle Shoals led the way with $13,901 in its lone theater, while Atharintiki Daaredi earned an average of $13,393 in 112 theaters. More...

Weekend Estimates: Meatballs Makes Tasty Debut

September 29th, 2013

As expected, Cloudy with a Chance of Meatballs 2 will be the comfortable winner of this weekend's box office race with a healthy $35 million beginning, according to Sony's Sunday estimate. That puts the film on course for the 4th-biggest weekend in September and is about $5 million ahead of the opening for the first film in the franchise. Given hopes of a $40 million debut, the film could be said to have underperformed slightly (and it will almost certainly not top the original's $124.8 million domestic total), but given the timing of the release, the studio will have reason for modest celebration in the midst of their worst year since 2005. The top of the chart in general has a middling-to-good-enough look to it this weekend. More...

Limited Releases Are What They Are

September 27th, 2013

There are a lot of limited releases on this week's list, including a few earning stellar reviews. There are also a few with weak reviews or that are the wrong genre to thrive in limited release. One film fits into both ends of the spectrum, We Are What We Are, which is earning great reviews, but as a horror film, likely won't find an audience till the home market. Hopefully I am wrong. Inequality for All is earning even better reviews, but it is a documentary, so it have very little chance to expand. On the Job has the best reviews of the week, but it is a foreign-language action film, so it will likely not earn breakout success. More...

Compare this performance with other movies…

Domestic Cumulative Box Office Records

Weekend Box Office Performance

DateRankGross% ChangeTheatersPer TheaterTotal GrossWeek
Sep 27, 2013 60 $13,901   1 $13,901   $13,901 1
Oct 4, 2013 62 $16,723 +20% 4 $4,181   $34,190 2
Oct 11, 2013 45 $50,419 +201% 14 $3,601   $95,235 3
Oct 18, 2013 37 $95,443 +89% 36 $2,651   $219,325 4
Oct 25, 2013 37 $82,966 -13% 56 $1,482   $341,525 5
Nov 1, 2013 36 $57,828 -30% 46 $1,257   $440,596 6
Nov 8, 2013 46 $34,265 -41% 46 $745   $505,223 7
Nov 15, 2013 43 $44,324 +29% 44 $1,007   $568,612 8
Nov 22, 2013 50 $13,780 -69% 25 $551   $607,323 9
Nov 29, 2013 51 $12,847 -7% 29 $443   $634,876 10
Dec 6, 2013 49 $6,562 -49% 13 $505   $647,197 11
Dec 13, 2013 50 $4,120 -37% 11 $375   $656,575 12
Dec 20, 2013 46 $2,306 -44% 9 $256   $663,065 13
Dec 27, 2013 54 $2,448 +6% 7 $350   $666,862 14
Jan 3, 2014 63 $2,188 -11% 5 $438   $671,810 15
Jan 10, 2014 57 $3,567 +63% 5 $713   $677,412 16
Jan 17, 2014 59 $2,336 -35% 11 $212   $681,613 17
Jan 24, 2014 63 $966 -59% 6 $161   $684,906 18
Jan 31, 2014 79 $973 +1% 5 $195   $687,694 19
Feb 7, 2014 77 $426 -56% 2 $213   $689,035 20
Feb 14, 2014 77 $1,164 +173% 3 $388   $690,199 21
Feb 21, 2014 90 $522 -55% 4 $131   $691,324 22
Feb 28, 2014 92 $227 -57% 2 $114   $691,789 23
Mar 7, 2014 93 $1,008 +344% 4 $252   $695,625 24

Daily Box Office Performance

Weekly Box Office Performance

DateRankGross% ChangeTheatersPer TheaterTotal GrossWeek
Sep 27, 2013 60 $17,467   1 $17,467   $17,467 1
Oct 4, 2013 59 $27,349 +57% 4 $6,837   $44,816 2
Oct 11, 2013 44 $79,066 +189% 14 $5,648   $123,882 3
Oct 18, 2013 37 $134,677 +70% 36 $3,741   $258,559 4
Oct 25, 2013 33 $124,209 -8% 56 $2,218   $382,768 5
Nov 1, 2013 32 $88,190 -29% 46 $1,917   $470,958 6
Nov 8, 2013 38 $53,330 -40% 46 $1,159   $524,288 7
Nov 15, 2013 39 $69,255 +30% 48 $1,443   $593,543 8
Nov 22, 2013 47 $28,486 -59% 25 $1,139   $622,029 9
Nov 29, 2013 46 $18,606 -35% 20 $930   $640,635 10
Dec 6, 2013 48 $11,820 -36% 13 $909   $652,455 11
Dec 13, 2013 52 $8,304 -30% 11 $755   $660,759 12
Dec 20, 2013 52 $3,655 -56% 9 $406   $664,414 13
Dec 27, 2013 52 $5,208 +42% 7 $744   $669,622 14
Jan 3, 2014 55 $4,223 -19% 5 $845   $673,845 15
Jan 10, 2014 52 $5,432 +29% 5 $1,086   $679,277 16
Jan 17, 2014 53 $4,663 -14% 11 $424   $683,940 17
Jan 24, 2014 60 $2,781 -40% 6 $464   $686,721 18
Jan 31, 2014 65 $1,888 -32% 5 $378   $688,609 19
Feb 14, 2014 74 $1,767   21 $84   $690,802 21
Feb 21, 2014 87 $760 -57% 5 $152   $691,562 22
Feb 28, 2014 74 $3,055 +302% 21 $145   $694,617 23
Mar 7, 2014 86 $1,624 -47% 4 $406   $696,241 24

Full financial estimates for this film, including domestic and international box office, video sales, video rentals, TV and ancillary revenue are available through our research services. For more information, please contact us at research@the-numbers.com.