Star Wars Ep. V: The Empire Strikes Back (1980)

Star Wars Ep. V: The Empire Strikes Back
Theatrical Performance
Domestic Box Office $291,738,960Details
International Box Office $257,262,126Details
Worldwide Box Office $549,001,086
Home Market Performance
Est. Domestic Blu-ray Sales $4,754,163 Details
Total Est. Domestic Video Sales $4,754,163
Further financial details...

Metrics

Opening Weekend:$4,910,483 (1.7% of total gross)
Legs:13.28 (domestic box office/biggest weekend)
Domestic Share:53.1% (domestic box office/worldwide)
Production Budget:$23,000,000 (worldwide box office is 23.9 times production budget)
Theater counts:126 opening theaters/2,322 max. theaters, 15.2 weeks average run per theater
Infl. Adj. Dom. BO $1,042,740,647

Latest Ranking on Cumulative Box Office Lists

See the Box Office tab (Domestic) and International tab (International and Worldwide) for more Cumulative Box Office Records.


Watch Now On

Movie Details

Domestic Releases: May 21st, 1980 (Wide) by 20th Century Fox
July 31st, 1981 (Wide) by 20th Century Fox
November 19th, 1982 (Wide) by 20th Century Fox
February 21st, 1997 (Wide) by 20th Century Fox
September 25th, 2020 (Special Engagement) by Walt Disney
International Releases: May 20th, 1980 (Wide) (United Kingdom)
December 12th, 1980 (Wide) (Netherlands)
April 10th, 1997 (Wide) (New Zealand)
July 24th, 2015 (Limited), released as Empire Strikes Back (Secret Cinema 2015), The (United Kingdom)
July 24th, 2020 (Wide) (Czech Republic)
... Show all releases
Video Release: September 12th, 2006 by Fox Home Entertainment, released as Star Wars Episode V - The Empire Strikes Back (1980 & 2004 versions)
MPAA Rating: PG for sci-fi action violence.
Running Time: 124 minutes
Franchise: Star Wars
Comparisons: vs. Star Wars Ep. IV: A New Hope
Create your own comparison chart…
Keywords: Visual Effects, Heroic Adventure, Fugitive / On the Run, Good vs. Evil, Rebellion, Mentor, Friendly Ghost
Source:Original Screenplay
Genre:Adventure
Production Method:Live Action
Creative Type:Science Fiction
Production/Financing Companies: Lucasfilm
Production Countries: United States
Languages: English

Ranking on other Records and Milestones

RecordRankAmountChart
Date
Days In
Release
Fastest to $250m 149 $262,895,196 Feb 28, 1997 6,130
Biggest Domestic February Weekend 88 $21,975,993 Feb 21, 1997 6,123
Thanksgiving (All Movies, 3-Day, Inflation Adjusted) 215 $13,564,111 Nov 26, 1982 922
Thanksgiving (All Movies, 5-Day, Inflation Adjusted) 220 $11,305,483 Nov 26, 1982 922
Biggest Domestic 65th Weekend 2 $2,077,984 Aug 14, 1981 453
Fastest to $100m 240 $200,877,589 Aug 14, 1981 453
Fastest to $150m 238 $200,877,589 Aug 14, 1981 453
Fastest to $200m 238 $200,877,589 Aug 14, 1981 453
Fastest to $50m 259 $200,877,589 Aug 14, 1981 453
Biggest Domestic 64th Weekend 1 $4,021,024 Aug 7, 1981 446
Biggest Domestic 63rd Weekend 1 $7,001,282 Jul 31, 1981 439
Theater Average 63rd Weekend 8 $5,133 Jul 31, 1981 439
Biggest Domestic 13th Weekend 27 $4,321,216 Aug 15, 1980 89
Biggest Domestic 12th Weekend 25 $4,554,679 Aug 8, 1980 82
Biggest Domestic 11th Weekend 26 $5,758,789 Aug 1, 1980 75
Theater Average 11th Weekend 89 $5,056 Aug 1, 1980 75
Biggest Domestic 10th Weekend 20 $7,130,000 Jul 25, 1980 68
Theater Average 10th Weekend 88 $5,579 Jul 25, 1980 68
Biggest Domestic 9th Weekend 34 $6,721,000 Jul 18, 1980 61
Theater Average 9th Weekend 85 $6,172 Jul 18, 1980 61
Biggest Domestic 8th Weekend 59 $6,652,858 Jul 11, 1980 54
Theater Average 8th Weekend 59 $7,754 Jul 11, 1980 54
Biggest Domestic 7th Weekend 54 $8,309,772 Jul 4, 1980 47
Theater Average 7th Weekend 51 $9,443 Jul 4, 1980 47
Independence Day (All Movies, 3-Day) 171 $8,309,772 Jul 4, 1980 47
Independence Day (All Movies, 3-Day, Inflation Adjusted) 78 $33,949,594 Jul 4, 1980 47
Biggest Domestic 6th Weekend 83 $9,217,874 Jun 27, 1980 40
Theater Average 6th Weekend 49 $11,228 Jun 27, 1980 40
Theater Average 5th Weekend 57 $12,734 Jun 20, 1980 33
Theater Average 4th Weekend 14 $28,619 Jun 13, 1980 26
Memorial Day (All Movies, 3-Day, Inflation Adjusted) 127 $20,061,783 May 23, 1980 5
Memorial Day (All Movies, 4-Day, Fri-Mon) 140 $6,415,804 May 23, 1980 5
Memorial Day (All Movies, 4-Day, Fri-Mon, Inflation Adjusted) 88 $26,211,776 May 23, 1980 5
Memorial Day (Opening, 3-Day) 87 $4,910,483 May 23, 1980 5
Memorial Day (Opening, 3-Day, Inflation Adjusted) 69 $20,061,783 May 23, 1980 5
Memorial Day (Opening, 4-Day, Fri-Mon) 53 $6,415,804 May 23, 1980 5
Memorial Day (Opening, 4-Day, Fri-Mon, Inflation Adjusted) 44 $26,211,776 May 23, 1980 5

Compare this performance with other movies…

Domestic Cumulative Box Office Records

Weekend Box Office Performance

DateRankGross% ChangeTheatersPer TheaterTotal GrossWeek
May 23, 1980 1 $4,910,483   126 $38,972   $7,244,308 1
Jun 13, 1980 3 $3,606,000   126 $28,619   $15,190,077 4
Jun 20, 1980 1 $10,480,307 +191% 823 $12,734   $47,332,853 5
Jun 27, 1980 1 $9,217,874 -12% 821 $11,228   $64,904,375 6
Jul 4, 1980 1 $8,309,772 -10% 880 $9,443   $81,958,005 7
Jul 11, 1980 1 $6,652,858 -20% 858 $7,754   $94,296,366 8
Jul 18, 1980 1 $6,721,000 +1% 1,089 $6,172   $105,714,000 9
Jul 25, 1980 1 $7,130,000 +6% 1,278 $5,579   $118,310,568 10
Aug 1, 1980 1 $5,758,789 -19% 1,139 $5,056   $130,000,000 11
Aug 8, 1980 1 $4,554,679 -21% 1,195 $3,811   $139,069,964 12
Aug 15, 1980 2 $4,321,216 -5% 1,208 $3,577   $145,893,923 13
Jul 31, 1981 1 $7,001,282   1,364 $5,133   $188,355,137 63
Aug 7, 1981 2 $4,021,024 -43% 1,382 $2,910   $196,613,195 64
Aug 14, 1981 7 $2,077,984 -48% 969 $2,144   $200,877,589 65
Nov 19, 1982 1 $3,949,478   992 $3,981   $213,347,503 131
Nov 26, 1982 4 $3,628,616 -8% 992 $3,658   $219,026,592 132
Dec 3, 1982 4 $1,573,157 -57% 909 $1,731   $221,286,895 133
Dec 10, 1982 7 $570,475 -64% 600 $951   $222,252,517 134
Dec 17, 1982 16 $206,294 -64% 600 $344   $222,674,266 135
Feb 21, 1997 1 $21,975,993   2,111 $10,410   $244,650,259 875
Feb 28, 1997 1 $13,145,852 -40% 2,111 $6,227   $262,895,196 876
Mar 7, 1997 3 $8,048,852 -39% 2,116 $3,804   $274,414,455 877
Mar 14, 1997 5 $5,127,288 -36% 2,322 $2,208   $282,216,979 878
Mar 21, 1997 9 $2,427,835 -53% 1,723 $1,409   $286,030,505 879
Mar 28, 1997 16 $927,623 -62% 591 $1,570   $287,904,768 880
Apr 4, 1997 24 $452,200 -51% 294 $1,538   $288,801,028 881
Apr 11, 1997 31 $198,951 -56% 190 $1,047   $289,122,801 882
Apr 18, 1997 41 $101,926 -49% 136 $749   $289,280,907 883
Apr 25, 1997 22 $379,587 +272% 751 $505   $289,697,968 884
May 2, 1997 28 $194,107 -49% 383 $507   $290,020,125 885
May 9, 1997 34 $76,610 -61% 189 $405   $290,158,751 886
Sep 25, 2020 5 $908,000   2,097 $433   $291,179,960 2,106
Oct 2, 2020 - $335,000 -63% 1,675 $200   $291,514,960 2,107
Oct 9, 2020 - $145,000 -57% 825 $176   $291,659,960 2,108
Oct 16, 2020 - $79,000 -46% 480 $165   $291,738,960 2,109

Daily Box Office Performance

DateRankGross%YD%LWTheatersPer TheaterTotal GrossDays
May 21, 1980 1 $1,333,305     126 $10,582   $1,333,305 1
May 22, 1980 1 $995,026 -25%   126 $7,897   $2,341,114 2
May 23, 1980 1 $1,397,356 +40%   126 $11,090   $3,738,470 3
May 24, 1980 1 $1,735,194 +24%   126 $13,771   $5,473,664 4
May 25, 1980 1 $1,770,644 +2%   126 $14,053   $7,244,308 5
May 26, 1980 1 $1,505,321 -15%   126 $11,947   $8,756,918 6
May 27, 1980 1 $855,745 -43%   126 $6,792   $9,612,663 7
Mar 28, 1981 1 $4,046     1 $4,046   $145,897,969 312
Apr 4, 1981 - $4,984   +23% 1 $4,984   $145,902,953 319
Apr 11, 1981 - $8,894   +78% 1 $8,894   $145,911,847 326
Apr 18, 1981 - $8,199   -8% 1 $8,199   $145,920,046 333
Apr 25, 1981 - $5,041   -39% 1 $5,041   $145,925,087 340
May 2, 1981 - $5,417   +7% 1 $5,417   $145,930,504 347
May 9, 1981 - $5,657   +4% 1 $5,657   $145,936,161 354
Sep 25, 2020 - $360,000     2,097 $172   $290,631,960 14,738
Sep 26, 2020 - $321,000 -11%   2,097 $153   $290,952,960 14,739
Sep 27, 2020 - $227,000 -29%   2,097 $108   $291,179,960 14,740
Oct 2, 2020 - $95,000   -74% 1,675 $57   $291,274,960 14,745
Oct 3, 2020 - $150,000 +58% -53% 1,675 $90   $291,424,960 14,746
Oct 4, 2020 - $90,000 -40% -60% 1,675 $54   $291,514,960 14,747
Oct 9, 2020 - $44,000   -54% 825 $53   $291,558,960 14,752
Oct 10, 2020 - $62,000 +41% -59% 825 $75   $291,620,960 14,753
Oct 11, 2020 - $39,000 -37% -57% 825 $47   $291,659,960 14,754
Oct 16, 2020 - $25,000   -43% 480 $52   $291,684,960 14,759
Oct 17, 2020 - $34,000 +36% -45% 480 $71   $291,718,960 14,760
Oct 18, 2020 - $20,000 -41% -49% 480 $42   $291,738,960 14,761

Weekly Box Office Performance

DateRankGross% ChangeTheatersPer TheaterTotal GrossWeek
Jun 13, 1980 1 $40,098,546   126 $318,242   $36,492,546 5
Jun 20, 1980 1 $19,193,955 -52% 823 $23,322   $55,686,501 6
Jun 27, 1980 1 $17,961,732 -6% 821 $21,878   $73,648,233 7
Jul 4, 1980 1 $13,995,275 -22% 880 $15,904   $87,643,508 8
Jul 11, 1980 1 $11,349,492 -19% 858 $13,228   $98,993,000 9
Jul 18, 1980 1 $12,187,568 +7% 1,089 $11,192   $111,180,568 10
Jul 25, 1980 1 $13,060,643 +7% 1,278 $10,220   $124,241,211 11
Aug 1, 1980 1 $10,274,074 -21% 1,139 $9,020   $134,515,285 12
Aug 8, 1980 1 $7,057,422 -31% 1,195 $5,906   $141,572,707 13
Jul 31, 1981 1 $11,238,316   1,364 $8,239   $192,592,171 64
Aug 7, 1981 2 $6,207,434 -45% 1,382 $4,492   $198,799,605 65
Nov 19, 1982 1 $5,999,951   992 $6,048   $215,397,976 132
Nov 26, 1982 5 $4,315,762 -28% 992 $4,351   $219,713,738 133
Dec 3, 1982 4 $1,968,304 -54% 909 $2,165   $221,682,042 134
Dec 10, 1982 7 $785,930 -60% 600 $1,310   $222,467,972 135
Feb 21, 1997 1 $27,075,078   2,111 $12,826   $249,749,344 876
Feb 28, 1997 1 $16,616,259 -39% 2,111 $7,871   $266,365,603 877
Mar 7, 1997 3 $10,724,088 -35% 2,116 $5,068   $277,089,691 878
Mar 14, 1997 5 $6,512,979 -39% 2,322 $2,805   $283,602,670 879
Mar 21, 1997 9 $3,374,475 -48% 1,723 $1,958   $286,977,145 880
Mar 28, 1997 16 $1,371,683 -59% 591 $2,321   $288,348,828 881
Apr 4, 1997 24 $575,022 -58% 294 $1,956   $288,923,850 882
Apr 11, 1997 30 $255,131 -56% 190 $1,343   $289,178,981 883
Apr 18, 1997 42 $139,400 -45% 136 $1,025   $289,318,381 884
Apr 25, 1997 22 $507,637 +264% 751 $676   $289,826,018 885
May 2, 1997 28 $256,123 -50% 383 $669   $290,082,141 886

Box Office Summary Per Territory

Territory Release
Date
Opening
Weekend
Opening
Weekend
Screens
Maximum
Screens
Theatrical
Engagements
Total
Box Office
Report
Date
Australia 9/11/2020 $230,344 191 191 365 $251,612 5/6/2024
Czech Republic 7/24/2020 $5,204 9 9 9 $5,204 10/19/2022
Netherlands 12/12/1980 $0 0 51 51 $24,342 10/19/2022
New Zealand 4/10/1997 $0 0 64 126 $30,151 5/6/2024
United Kingdom 5/20/1980 $0 0 292 1,167 $10,844,166 10/2/2024
 
Rest of World $246,106,651
 
International Total$257,262,126 10/2/2024

International Cumulative Box Office Records


Worldwide Cumulative Box Office Records


Weekly US DVD Sales

DateRankUnits
this
Week
% ChangeTotal
Units
Spending
this
Week
Total
Spending
Weeks
in
Release
Sep 17, 20066198,520 198,520$3,547,552$3,547,5521
Sep 24, 20062671,632-64% 270,152$1,403,987$4,951,5392

Weekly US Blu-ray Sales

DateRankUnits
this
Week
% ChangeTotal
Units
Spending
this
Week
Total
Spending
Weeks
in
Release
Nov 15, 20151020,460 20,460$306,492$306,492479
Dec 27, 20151945,004 97,021$763,268$1,604,964485
May 7, 2023115,929 230,384$203,068$4,739,389869

Our DVD and Blu-ray sales estimates are based on weekly retail surveys, which we use to build a weekly market share estimate for each title we are tracking. The market share is converted into a weekly sales estimate based on industry reports on the overall size of the market, including reports published in Media Play News.

For example, if our weekly retail survey estimates that a particular title sold 1% of all units that week, and the industry reports sales of 1,500,000 units in total, we will estimate 15,000 units were sold of that title. The consumer spending estimate is based on the average sales price for the title in the retailers we survey.

We refine our estimates from week to week as more data becomes available. In particular, we adjust weekly sales figures for the quarter once the total market estimates are published by the Digital Entertainment Group. Figures will therefore fluctuate each week, and totals for individual titles can go up or down as we update our estimates.

Because sales figures are estimated based on sampling, they will be more accurate for higher-selling titles.

Leading Cast

Mark Hamill Luke Skywalker
Harrison Ford Hans Solo
Carrie Fisher Princess Leia Organa

Supporting Cast

Billy Dee Williams Lando Calrissian
Anthony Daniels C-3PO
David Prowse Darth Vader
Kenny Baker R2-D2
Peter Mayhew Chewbacca
Frank Oz Yoda
Alec Guinness Jedi Knight Obi-Wan (Ben) Kenobi
Jeremy Bulloch Boba Fett/Imperial Officer at Cloud City
John Hollis Lando's Aide
Jack Purvis Chief Ugnaught
Des Webb Snow Creature
Clive Revill Voice of Emperor
Kenneth Colley Captain/Admiral Piett
Julian Glover General Veers
Michael Sheard Admiral Ozzel
Michael Culver Captain Needa
John Dicks Officer
Milton Johns Officer
Mark Jones Officer
Oliver Maguire Officer
Robin Scobey Officer
Bruce Boa General Rieekan
Christopher Malcolm Zev, Rogue 2
Dennis Lawson Wedge, Rogue 3
Richard Oldfield Hobbie, Rogue 4
John Morton Dak, Luke's Gunner
Ian Liston Janson, Wedge's Gunner
John Ratzenberger Major Bren Derlin
Jack McKenzie Deck Lieutenant
Jerry Harte Head Controller
Norman Chancer Officer
Norwich Duff Officer
Ray Hassett Officer
Brigitte Kahn Officer
Burnell Tucker Officer
James Earl Jones Voice of Darth Vader

For a description of the different acting role types we use to categorize acting perfomances, see our Glossary.

Production and Technical Credits

Irvin Kershner Director
Leigh Brackett Screenwriter
Lawrence Kasdan Screenwriter
George Lucas Based on a Story by
Gary Kurtz Producer
George Lucas Executive Producer
Norman Reynolds Production Designer
Ralph McQuarrie Production Designer-Design Consultant and Conceptual Artist
Paul Hirsch Editor
John Williams Composer
Peter Suschitzky Director of Photography
Robert Watts Associate Producer
James Bloom Associate Producer
Bruce Sharman Production Supervisor
David Tomblin Assistant Director
Harley Cokliss Second Unit Director
John Barry Second Unit Director
Peter MacDonald Second Unit Director
Leslie Dilley Art Director
Harry Lange Art Director
Alan Tomkins Art Director
Michael Ford Set Decorator
Chris Menges Second Unit Camera
Geoff Glover Second Unit Camera
Brian Johnson, Jr. Visual Effects Designer
Richard Edlund Visual Effects Designer
Dennis Muren Visual Effects-Director of Photography
Bruce Nicholson Visual Effects-Optical Photography Supervisor
John Mollo Costume Designer
Tiny Nicholls Costume Supervisor
Peter Sutton Sound Mixer
Bill Varney Re-recording Mixer
Steve Maslow Re-recording Mixer
Gregg Landaker Re-recording Mixer
Ben Burtt Supervising Sound Effects Editor
Richard Burrow Sound Editor
Teresa Eckton Sound Editor
Bonnie Koehler Sound Editor
Ben Burtt Sound Designer
Curt Schulkey Dialogue Editor
Leslie Shatz Dialogue Editor
Joanne D'Antonio Dialogue Editor
Ken Wannberg Supervising Music Editor
Graham Freeborn Make up
Barbara Ritchie Hairstylist
Stuart Freeborn Special Make up Effects-Creature Design
Irene Lamb Casting Director
Terry Liebling Casting Director
Bob Edmiston Casting Director
Peter Diamond Stunt Coordinator

The bold credits above the line are the "above-the-line" credits, the other the "below-the-line" credits.

Weekend predictions: Tenet to top glum box office for fifth week

October 1st, 2020

Tenet

September is normally the slowest month of the year at the box office as the Summer season winds down and studios start prepping for the holidays and Oscar season. The build-up to the end of the year usually starts in early October. This weekend last year, for example, Joker opened with a massive $96 million weekend that kicked off a big Fall season. This year, a re-release of Hocus Pocus is the highlight, and $3 million will be enough to top the chart. Times really are dismal, and our model is predicting another down week. Unless a new release surprises in October (something that looks unlikely, given the slate), we’ll be headed for a down month at the box office, at a time when the industry desperately needs some good news. More...

Weekend estimates: Tenet leads lackluster weekend

September 27th, 2020

Tenet

This was never going to be a weekend for the record books, but the estimates released on Sunday morning reveal a theatrical market that’s barely clinging to life. With no major new releases, Tenet will win by default, but its $3.4 million projected weekend is down 28% from last time around, and the market as a whole looks as though it has weakened by about 20% in the last seven days. The biggest new release of the weekend is almost certainly Break the Silence: The Movie, which is rumored to have opened with around $1 million, putting it in a tie for third with Unhinged. The New Mutants remains in second place, with Disney projecting $1.147 million for the weekend. More...

Weekend predictions: movies are showing better legs during the pandemic

September 24th, 2020

Disney’s announcement earlier this week that it is moving its upcoming MCU releases into 2021, starting with Black Widow taking over Shang Chi’s previous slot on May 7, was a body-blow to the theatrical business. October’s release schedule is now looking very thin indeed. November isn’t looking much better, and there’s a high probability that at least one of No Time to Die, Soul, and The Croods: A New Age will slip from their current planned release dates.

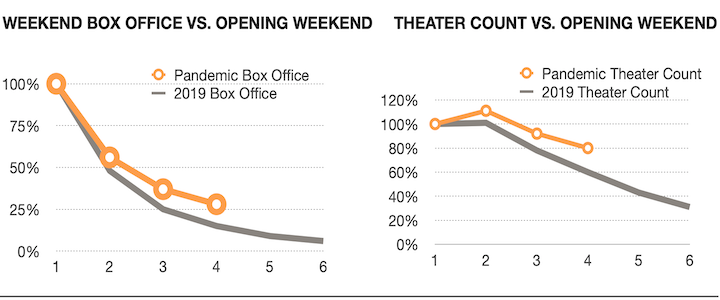
This weekend has four films technically opening wide: the re-release of The Empire Strikes Back, Shortcut (an Italian horror movie from Gravitas Ventures, opening in around 600 locations), and two movies honoring Ruth Bader Ginsberg, On the Basis of Sex and RBG. However, all of them are such special cases that they don’t fit our prediction model. Instead, I’ll focus on a rare piece of good news: films currently playing in theaters are showing better week-to-week legs than was the case before the pandemic. More...

Weekend Wrap-Up: Empire Strikes Back, Again

July 14th, 2020

Disney

For the third time in the past 40 years, The Empire Strikes Back opened in first place on the weekend box office chart. According to Deadline, the film pulled in $611,000 over the three-day weekend for a total opening of $644,000. This puts it near the very top of the pandemic re-releases, ahead of last week’s winner, Ghostbusters, looking at the three-day figure, but behind it over five. More...

2011 Holiday Gift Guide: Part I

November 23rd, 2011

This weekend is Thanksgiving and as always that means Black Friday and Cyber Monday plus 48 hours of shopping in-between. And as always, I've already done my Christmas shopping, for the most part. (I'm still waiting to see if the B.C.Lions win the Grey Cup. If not, I'll need to look for an alternative gift.) For everyone else who is still searching, we present the first part in our annual Holiday Gift Guide. As usual, the gift guide is divided into several sections, starting with Major Movie Releases. These are first run releases, franchise box sets, etc. However, before we get into the individual titles, we will start with an update on... More...

Blu-ray Sales: Transformers Soar Past the Moon

October 14th, 2011

Transformers: Dark of the Moon dominated the new releases and the Blu-ray sales chart in a way few films have managed. It sold 1.42 million units generating $29.66 million from Friday through Sunday. Its opening Blu-ray ratio was 64%, which is a record for a first-run release. It also represented 68% of all Blu-rays sold, which is mind-boggling. More...

Blu-ray Sales: Bridesmaids Highlight of Banner Week

October 5th, 2011

Bridesmaids led the way on the Blu-ray sales chart, just as it did on the DVD sales chart. It was by far the best new release selling 593,000 units and generating $13.30 million in revenue. Its opening week Blu-ray ratio was 30%, which is very high for this type of release and further proof Blu-ray is taking over from DVD. More...

Blu-ray Sales: Thor Goes to War

September 28th, 2011

There are three major releases on this week's Blu-ray sales chart, including one that was released a little early, and one that was released a little late. Leading the way in terms of units sold is Thor with 799,000 units / $22.00 million. Its opening Blu-ray ratio was just a hair under 50% and that's a figure that will quickly become the norm for blockbuster releases. More...

DVD and Blu-ray Releases for September 13th, 2011

September 13th, 2011

It is an incredibly busy week on the home market with several major releases, including Thor on Blu-ray, as well as Star Wars The Complete Saga, which comes out this Friday. Unfortunately, neither of the screeners have arrived yet, so it is hard to tell if they are pick of the week material. I figured Star Wars would easily take that honor, but the changes made have pissed off enough people that I think it's best that I hold off making a judgment till after it arrives. After spending way too long trying to pick between the two, I'm going with Degrassi: Season Ten, Part Two instead. More...


  1. Summary
  2. News
  3. Box Office
  4. International
  5. Video Sales
  6. Cast & Crew
  7. Trailer

Metrics

Opening Weekend:$4,910,483 (1.7% of total gross)
Legs:13.28 (domestic box office/biggest weekend)
Domestic Share:53.1% (domestic box office/worldwide)
Production Budget:$23,000,000 (worldwide box office is 23.9 times production budget)
Theater counts:126 opening theaters/2,322 max. theaters, 15.2 weeks average run per theater
Infl. Adj. Dom. BO $1,042,740,647

Latest Ranking on Cumulative Box Office Lists

See the Box Office tab (Domestic) and International tab (International and Worldwide) for more Cumulative Box Office Records.


Watch Now On

Movie Details

Domestic Releases: May 21st, 1980 (Wide) by 20th Century Fox
July 31st, 1981 (Wide) by 20th Century Fox
November 19th, 1982 (Wide) by 20th Century Fox
February 21st, 1997 (Wide) by 20th Century Fox
September 25th, 2020 (Special Engagement) by Walt Disney
International Releases: May 20th, 1980 (Wide) (United Kingdom)
December 12th, 1980 (Wide) (Netherlands)
April 10th, 1997 (Wide) (New Zealand)
July 24th, 2015 (Limited), released as Empire Strikes Back (Secret Cinema 2015), The (United Kingdom)
July 24th, 2020 (Wide) (Czech Republic)
... Show all releases
Video Release: September 12th, 2006 by Fox Home Entertainment, released as Star Wars Episode V - The Empire Strikes Back (1980 & 2004 versions)
MPAA Rating: PG for sci-fi action violence.
Running Time: 124 minutes
Franchise: Star Wars
Comparisons: vs. Star Wars Ep. IV: A New Hope
Create your own comparison chart…
Keywords: Visual Effects, Heroic Adventure, Fugitive / On the Run, Good vs. Evil, Rebellion, Mentor, Friendly Ghost
Source:Original Screenplay
Genre:Adventure
Production Method:Live Action
Creative Type:Science Fiction
Production/Financing Companies: Lucasfilm
Production Countries: United States
Languages: English

Ranking on other Records and Milestones

RecordRankAmountChart
Date
Days In
Release
Fastest to $250m 149 $262,895,196 Feb 28, 1997 6,130
Biggest Domestic February Weekend 88 $21,975,993 Feb 21, 1997 6,123
Thanksgiving (All Movies, 3-Day, Inflation Adjusted) 215 $13,564,111 Nov 26, 1982 922
Thanksgiving (All Movies, 5-Day, Inflation Adjusted) 220 $11,305,483 Nov 26, 1982 922
Biggest Domestic 65th Weekend 2 $2,077,984 Aug 14, 1981 453
Fastest to $100m 240 $200,877,589 Aug 14, 1981 453
Fastest to $150m 238 $200,877,589 Aug 14, 1981 453
Fastest to $200m 238 $200,877,589 Aug 14, 1981 453
Fastest to $50m 259 $200,877,589 Aug 14, 1981 453
Biggest Domestic 64th Weekend 1 $4,021,024 Aug 7, 1981 446
Biggest Domestic 63rd Weekend 1 $7,001,282 Jul 31, 1981 439
Theater Average 63rd Weekend 8 $5,133 Jul 31, 1981 439
Biggest Domestic 13th Weekend 27 $4,321,216 Aug 15, 1980 89
Biggest Domestic 12th Weekend 25 $4,554,679 Aug 8, 1980 82
Biggest Domestic 11th Weekend 26 $5,758,789 Aug 1, 1980 75
Theater Average 11th Weekend 89 $5,056 Aug 1, 1980 75
Biggest Domestic 10th Weekend 20 $7,130,000 Jul 25, 1980 68
Theater Average 10th Weekend 88 $5,579 Jul 25, 1980 68
Biggest Domestic 9th Weekend 34 $6,721,000 Jul 18, 1980 61
Theater Average 9th Weekend 85 $6,172 Jul 18, 1980 61
Biggest Domestic 8th Weekend 59 $6,652,858 Jul 11, 1980 54
Theater Average 8th Weekend 59 $7,754 Jul 11, 1980 54
Biggest Domestic 7th Weekend 54 $8,309,772 Jul 4, 1980 47
Theater Average 7th Weekend 51 $9,443 Jul 4, 1980 47
Independence Day (All Movies, 3-Day) 171 $8,309,772 Jul 4, 1980 47
Independence Day (All Movies, 3-Day, Inflation Adjusted) 78 $33,949,594 Jul 4, 1980 47
Biggest Domestic 6th Weekend 83 $9,217,874 Jun 27, 1980 40
Theater Average 6th Weekend 49 $11,228 Jun 27, 1980 40
Theater Average 5th Weekend 57 $12,734 Jun 20, 1980 33
Theater Average 4th Weekend 14 $28,619 Jun 13, 1980 26
Memorial Day (All Movies, 3-Day, Inflation Adjusted) 127 $20,061,783 May 23, 1980 5
Memorial Day (All Movies, 4-Day, Fri-Mon) 140 $6,415,804 May 23, 1980 5
Memorial Day (All Movies, 4-Day, Fri-Mon, Inflation Adjusted) 88 $26,211,776 May 23, 1980 5
Memorial Day (Opening, 3-Day) 87 $4,910,483 May 23, 1980 5
Memorial Day (Opening, 3-Day, Inflation Adjusted) 69 $20,061,783 May 23, 1980 5
Memorial Day (Opening, 4-Day, Fri-Mon) 53 $6,415,804 May 23, 1980 5
Memorial Day (Opening, 4-Day, Fri-Mon, Inflation Adjusted) 44 $26,211,776 May 23, 1980 5

Leading Cast

Mark Hamill Luke Skywalker
Harrison Ford Hans Solo
Carrie Fisher Princess Leia Organa

Supporting Cast

Billy Dee Williams Lando Calrissian
Anthony Daniels C-3PO
David Prowse Darth Vader
Kenny Baker R2-D2
Peter Mayhew Chewbacca
Frank Oz Yoda
Alec Guinness Jedi Knight Obi-Wan (Ben) Kenobi
Jeremy Bulloch Boba Fett/Imperial Officer at Cloud City
John Hollis Lando's Aide
Jack Purvis Chief Ugnaught
Des Webb Snow Creature
Clive Revill Voice of Emperor
Kenneth Colley Captain/Admiral Piett
Julian Glover General Veers
Michael Sheard Admiral Ozzel
Michael Culver Captain Needa
John Dicks Officer
Milton Johns Officer
Mark Jones Officer
Oliver Maguire Officer
Robin Scobey Officer
Bruce Boa General Rieekan
Christopher Malcolm Zev, Rogue 2
Dennis Lawson Wedge, Rogue 3
Richard Oldfield Hobbie, Rogue 4
John Morton Dak, Luke's Gunner
Ian Liston Janson, Wedge's Gunner
John Ratzenberger Major Bren Derlin
Jack McKenzie Deck Lieutenant
Jerry Harte Head Controller
Norman Chancer Officer
Norwich Duff Officer
Ray Hassett Officer
Brigitte Kahn Officer
Burnell Tucker Officer
James Earl Jones Voice of Darth Vader

For a description of the different acting role types we use to categorize acting perfomances, see our Glossary.

Production and Technical Credits

Irvin Kershner Director
Leigh Brackett Screenwriter
Lawrence Kasdan Screenwriter
George Lucas Based on a Story by
Gary Kurtz Producer
George Lucas Executive Producer
Norman Reynolds Production Designer
Ralph McQuarrie Production Designer-Design Consultant and Conceptual Artist
Paul Hirsch Editor
John Williams Composer
Peter Suschitzky Director of Photography
Robert Watts Associate Producer
James Bloom Associate Producer
Bruce Sharman Production Supervisor
David Tomblin Assistant Director
Harley Cokliss Second Unit Director
John Barry Second Unit Director
Peter MacDonald Second Unit Director
Leslie Dilley Art Director
Harry Lange Art Director
Alan Tomkins Art Director
Michael Ford Set Decorator
Chris Menges Second Unit Camera
Geoff Glover Second Unit Camera
Brian Johnson, Jr. Visual Effects Designer
Richard Edlund Visual Effects Designer
Dennis Muren Visual Effects-Director of Photography
Bruce Nicholson Visual Effects-Optical Photography Supervisor
John Mollo Costume Designer
Tiny Nicholls Costume Supervisor
Peter Sutton Sound Mixer
Bill Varney Re-recording Mixer
Steve Maslow Re-recording Mixer
Gregg Landaker Re-recording Mixer
Ben Burtt Supervising Sound Effects Editor
Richard Burrow Sound Editor
Teresa Eckton Sound Editor
Bonnie Koehler Sound Editor
Ben Burtt Sound Designer
Curt Schulkey Dialogue Editor
Leslie Shatz Dialogue Editor
Joanne D'Antonio Dialogue Editor
Ken Wannberg Supervising Music Editor
Graham Freeborn Make up
Barbara Ritchie Hairstylist
Stuart Freeborn Special Make up Effects-Creature Design
Irene Lamb Casting Director
Terry Liebling Casting Director
Bob Edmiston Casting Director
Peter Diamond Stunt Coordinator

The bold credits above the line are the "above-the-line" credits, the other the "below-the-line" credits.

Weekend predictions: Tenet to top glum box office for fifth week

October 1st, 2020

Tenet

September is normally the slowest month of the year at the box office as the Summer season winds down and studios start prepping for the holidays and Oscar season. The build-up to the end of the year usually starts in early October. This weekend last year, for example, Joker opened with a massive $96 million weekend that kicked off a big Fall season. This year, a re-release of Hocus Pocus is the highlight, and $3 million will be enough to top the chart. Times really are dismal, and our model is predicting another down week. Unless a new release surprises in October (something that looks unlikely, given the slate), we’ll be headed for a down month at the box office, at a time when the industry desperately needs some good news. More...

Weekend estimates: Tenet leads lackluster weekend

September 27th, 2020

Tenet

This was never going to be a weekend for the record books, but the estimates released on Sunday morning reveal a theatrical market that’s barely clinging to life. With no major new releases, Tenet will win by default, but its $3.4 million projected weekend is down 28% from last time around, and the market as a whole looks as though it has weakened by about 20% in the last seven days. The biggest new release of the weekend is almost certainly Break the Silence: The Movie, which is rumored to have opened with around $1 million, putting it in a tie for third with Unhinged. The New Mutants remains in second place, with Disney projecting $1.147 million for the weekend. More...

Weekend predictions: movies are showing better legs during the pandemic

September 24th, 2020

Disney’s announcement earlier this week that it is moving its upcoming MCU releases into 2021, starting with Black Widow taking over Shang Chi’s previous slot on May 7, was a body-blow to the theatrical business. October’s release schedule is now looking very thin indeed. November isn’t looking much better, and there’s a high probability that at least one of No Time to Die, Soul, and The Croods: A New Age will slip from their current planned release dates.

This weekend has four films technically opening wide: the re-release of The Empire Strikes Back, Shortcut (an Italian horror movie from Gravitas Ventures, opening in around 600 locations), and two movies honoring Ruth Bader Ginsberg, On the Basis of Sex and RBG. However, all of them are such special cases that they don’t fit our prediction model. Instead, I’ll focus on a rare piece of good news: films currently playing in theaters are showing better week-to-week legs than was the case before the pandemic. More...

Weekend Wrap-Up: Empire Strikes Back, Again

July 14th, 2020

Disney

For the third time in the past 40 years, The Empire Strikes Back opened in first place on the weekend box office chart. According to Deadline, the film pulled in $611,000 over the three-day weekend for a total opening of $644,000. This puts it near the very top of the pandemic re-releases, ahead of last week’s winner, Ghostbusters, looking at the three-day figure, but behind it over five. More...

2011 Holiday Gift Guide: Part I

November 23rd, 2011

This weekend is Thanksgiving and as always that means Black Friday and Cyber Monday plus 48 hours of shopping in-between. And as always, I've already done my Christmas shopping, for the most part. (I'm still waiting to see if the B.C.Lions win the Grey Cup. If not, I'll need to look for an alternative gift.) For everyone else who is still searching, we present the first part in our annual Holiday Gift Guide. As usual, the gift guide is divided into several sections, starting with Major Movie Releases. These are first run releases, franchise box sets, etc. However, before we get into the individual titles, we will start with an update on... More...

Blu-ray Sales: Transformers Soar Past the Moon

October 14th, 2011

Transformers: Dark of the Moon dominated the new releases and the Blu-ray sales chart in a way few films have managed. It sold 1.42 million units generating $29.66 million from Friday through Sunday. Its opening Blu-ray ratio was 64%, which is a record for a first-run release. It also represented 68% of all Blu-rays sold, which is mind-boggling. More...

Blu-ray Sales: Bridesmaids Highlight of Banner Week

October 5th, 2011

Bridesmaids led the way on the Blu-ray sales chart, just as it did on the DVD sales chart. It was by far the best new release selling 593,000 units and generating $13.30 million in revenue. Its opening week Blu-ray ratio was 30%, which is very high for this type of release and further proof Blu-ray is taking over from DVD. More...

Blu-ray Sales: Thor Goes to War

September 28th, 2011

There are three major releases on this week's Blu-ray sales chart, including one that was released a little early, and one that was released a little late. Leading the way in terms of units sold is Thor with 799,000 units / $22.00 million. Its opening Blu-ray ratio was just a hair under 50% and that's a figure that will quickly become the norm for blockbuster releases. More...

DVD and Blu-ray Releases for September 13th, 2011

September 13th, 2011

It is an incredibly busy week on the home market with several major releases, including Thor on Blu-ray, as well as Star Wars The Complete Saga, which comes out this Friday. Unfortunately, neither of the screeners have arrived yet, so it is hard to tell if they are pick of the week material. I figured Star Wars would easily take that honor, but the changes made have pissed off enough people that I think it's best that I hold off making a judgment till after it arrives. After spending way too long trying to pick between the two, I'm going with Degrassi: Season Ten, Part Two instead. More...

Compare this performance with other movies…

Domestic Cumulative Box Office Records

Weekend Box Office Performance

DateRankGross% ChangeTheatersPer TheaterTotal GrossWeek
May 23, 1980 1 $4,910,483   126 $38,972   $7,244,308 1
Jun 13, 1980 3 $3,606,000   126 $28,619   $15,190,077 4
Jun 20, 1980 1 $10,480,307 +191% 823 $12,734   $47,332,853 5
Jun 27, 1980 1 $9,217,874 -12% 821 $11,228   $64,904,375 6
Jul 4, 1980 1 $8,309,772 -10% 880 $9,443   $81,958,005 7
Jul 11, 1980 1 $6,652,858 -20% 858 $7,754   $94,296,366 8
Jul 18, 1980 1 $6,721,000 +1% 1,089 $6,172   $105,714,000 9
Jul 25, 1980 1 $7,130,000 +6% 1,278 $5,579   $118,310,568 10
Aug 1, 1980 1 $5,758,789 -19% 1,139 $5,056   $130,000,000 11
Aug 8, 1980 1 $4,554,679 -21% 1,195 $3,811   $139,069,964 12
Aug 15, 1980 2 $4,321,216 -5% 1,208 $3,577   $145,893,923 13
Jul 31, 1981 1 $7,001,282   1,364 $5,133   $188,355,137 63
Aug 7, 1981 2 $4,021,024 -43% 1,382 $2,910   $196,613,195 64
Aug 14, 1981 7 $2,077,984 -48% 969 $2,144   $200,877,589 65
Nov 19, 1982 1 $3,949,478   992 $3,981   $213,347,503 131
Nov 26, 1982 4 $3,628,616 -8% 992 $3,658   $219,026,592 132
Dec 3, 1982 4 $1,573,157 -57% 909 $1,731   $221,286,895 133
Dec 10, 1982 7 $570,475 -64% 600 $951   $222,252,517 134
Dec 17, 1982 16 $206,294 -64% 600 $344   $222,674,266 135
Feb 21, 1997 1 $21,975,993   2,111 $10,410   $244,650,259 875
Feb 28, 1997 1 $13,145,852 -40% 2,111 $6,227   $262,895,196 876
Mar 7, 1997 3 $8,048,852 -39% 2,116 $3,804   $274,414,455 877
Mar 14, 1997 5 $5,127,288 -36% 2,322 $2,208   $282,216,979 878
Mar 21, 1997 9 $2,427,835 -53% 1,723 $1,409   $286,030,505 879
Mar 28, 1997 16 $927,623 -62% 591 $1,570   $287,904,768 880
Apr 4, 1997 24 $452,200 -51% 294 $1,538   $288,801,028 881
Apr 11, 1997 31 $198,951 -56% 190 $1,047   $289,122,801 882
Apr 18, 1997 41 $101,926 -49% 136 $749   $289,280,907 883
Apr 25, 1997 22 $379,587 +272% 751 $505   $289,697,968 884
May 2, 1997 28 $194,107 -49% 383 $507   $290,020,125 885
May 9, 1997 34 $76,610 -61% 189 $405   $290,158,751 886
Sep 25, 2020 5 $908,000   2,097 $433   $291,179,960 2,106
Oct 2, 2020 - $335,000 -63% 1,675 $200   $291,514,960 2,107
Oct 9, 2020 - $145,000 -57% 825 $176   $291,659,960 2,108
Oct 16, 2020 - $79,000 -46% 480 $165   $291,738,960 2,109

Daily Box Office Performance

DateRankGross%YD%LWTheatersPer TheaterTotal GrossDays
May 21, 1980 1 $1,333,305     126 $10,582   $1,333,305 1
May 22, 1980 1 $995,026 -25%   126 $7,897   $2,341,114 2
May 23, 1980 1 $1,397,356 +40%   126 $11,090   $3,738,470 3
May 24, 1980 1 $1,735,194 +24%   126 $13,771   $5,473,664 4
May 25, 1980 1 $1,770,644 +2%   126 $14,053   $7,244,308 5
May 26, 1980 1 $1,505,321 -15%   126 $11,947   $8,756,918 6
May 27, 1980 1 $855,745 -43%   126 $6,792   $9,612,663 7
Mar 28, 1981 1 $4,046     1 $4,046   $145,897,969 312
Apr 4, 1981 - $4,984   +23% 1 $4,984   $145,902,953 319
Apr 11, 1981 - $8,894   +78% 1 $8,894   $145,911,847 326
Apr 18, 1981 - $8,199   -8% 1 $8,199   $145,920,046 333
Apr 25, 1981 - $5,041   -39% 1 $5,041   $145,925,087 340
May 2, 1981 - $5,417   +7% 1 $5,417   $145,930,504 347
May 9, 1981 - $5,657   +4% 1 $5,657   $145,936,161 354
Sep 25, 2020 - $360,000     2,097 $172   $290,631,960 14,738
Sep 26, 2020 - $321,000 -11%   2,097 $153   $290,952,960 14,739
Sep 27, 2020 - $227,000 -29%   2,097 $108   $291,179,960 14,740
Oct 2, 2020 - $95,000   -74% 1,675 $57   $291,274,960 14,745
Oct 3, 2020 - $150,000 +58% -53% 1,675 $90   $291,424,960 14,746
Oct 4, 2020 - $90,000 -40% -60% 1,675 $54   $291,514,960 14,747
Oct 9, 2020 - $44,000   -54% 825 $53   $291,558,960 14,752
Oct 10, 2020 - $62,000 +41% -59% 825 $75   $291,620,960 14,753
Oct 11, 2020 - $39,000 -37% -57% 825 $47   $291,659,960 14,754
Oct 16, 2020 - $25,000   -43% 480 $52   $291,684,960 14,759
Oct 17, 2020 - $34,000 +36% -45% 480 $71   $291,718,960 14,760
Oct 18, 2020 - $20,000 -41% -49% 480 $42   $291,738,960 14,761

Weekly Box Office Performance

DateRankGross% ChangeTheatersPer TheaterTotal GrossWeek
Jun 13, 1980 1 $40,098,546   126 $318,242   $36,492,546 5
Jun 20, 1980 1 $19,193,955 -52% 823 $23,322   $55,686,501 6
Jun 27, 1980 1 $17,961,732 -6% 821 $21,878   $73,648,233 7
Jul 4, 1980 1 $13,995,275 -22% 880 $15,904   $87,643,508 8
Jul 11, 1980 1 $11,349,492 -19% 858 $13,228   $98,993,000 9
Jul 18, 1980 1 $12,187,568 +7% 1,089 $11,192   $111,180,568 10
Jul 25, 1980 1 $13,060,643 +7% 1,278 $10,220   $124,241,211 11
Aug 1, 1980 1 $10,274,074 -21% 1,139 $9,020   $134,515,285 12
Aug 8, 1980 1 $7,057,422 -31% 1,195 $5,906   $141,572,707 13
Jul 31, 1981 1 $11,238,316   1,364 $8,239   $192,592,171 64
Aug 7, 1981 2 $6,207,434 -45% 1,382 $4,492   $198,799,605 65
Nov 19, 1982 1 $5,999,951   992 $6,048   $215,397,976 132
Nov 26, 1982 5 $4,315,762 -28% 992 $4,351   $219,713,738 133
Dec 3, 1982 4 $1,968,304 -54% 909 $2,165   $221,682,042 134
Dec 10, 1982 7 $785,930 -60% 600 $1,310   $222,467,972 135
Feb 21, 1997 1 $27,075,078   2,111 $12,826   $249,749,344 876
Feb 28, 1997 1 $16,616,259 -39% 2,111 $7,871   $266,365,603 877
Mar 7, 1997 3 $10,724,088 -35% 2,116 $5,068   $277,089,691 878
Mar 14, 1997 5 $6,512,979 -39% 2,322 $2,805   $283,602,670 879
Mar 21, 1997 9 $3,374,475 -48% 1,723 $1,958   $286,977,145 880
Mar 28, 1997 16 $1,371,683 -59% 591 $2,321   $288,348,828 881
Apr 4, 1997 24 $575,022 -58% 294 $1,956   $288,923,850 882
Apr 11, 1997 30 $255,131 -56% 190 $1,343   $289,178,981 883
Apr 18, 1997 42 $139,400 -45% 136 $1,025   $289,318,381 884
Apr 25, 1997 22 $507,637 +264% 751 $676   $289,826,018 885
May 2, 1997 28 $256,123 -50% 383 $669   $290,082,141 886

Box Office Summary Per Territory

Territory Release
Date
Opening
Weekend
Opening
Weekend
Screens
Maximum
Screens
Theatrical
Engagements
Total
Box Office
Report
Date
Australia 9/11/2020 $230,344 191 191 365 $251,612 5/6/2024
Czech Republic 7/24/2020 $5,204 9 9 9 $5,204 10/19/2022
Netherlands 12/12/1980 $0 0 51 51 $24,342 10/19/2022
New Zealand 4/10/1997 $0 0 64 126 $30,151 5/6/2024
United Kingdom 5/20/1980 $0 0 292 1,167 $10,844,166 10/2/2024
 
Rest of World $246,106,651
 
International Total$257,262,126 10/2/2024

International Cumulative Box Office Records


Worldwide Cumulative Box Office Records


Weekly US DVD Sales

DateRankUnits
this
Week
% ChangeTotal
Units
Spending
this
Week
Total
Spending
Weeks
in
Release
Sep 17, 20066198,520 198,520$3,547,552$3,547,5521
Sep 24, 20062671,632-64% 270,152$1,403,987$4,951,5392

Weekly US Blu-ray Sales

DateRankUnits
this
Week
% ChangeTotal
Units
Spending
this
Week
Total
Spending
Weeks
in
Release
Nov 15, 20151020,460 20,460$306,492$306,492479
Dec 27, 20151945,004 97,021$763,268$1,604,964485
May 7, 2023115,929 230,384$203,068$4,739,389869

Our DVD and Blu-ray sales estimates are based on weekly retail surveys, which we use to build a weekly market share estimate for each title we are tracking. The market share is converted into a weekly sales estimate based on industry reports on the overall size of the market, including reports published in Media Play News.

For example, if our weekly retail survey estimates that a particular title sold 1% of all units that week, and the industry reports sales of 1,500,000 units in total, we will estimate 15,000 units were sold of that title. The consumer spending estimate is based on the average sales price for the title in the retailers we survey.

We refine our estimates from week to week as more data becomes available. In particular, we adjust weekly sales figures for the quarter once the total market estimates are published by the Digital Entertainment Group. Figures will therefore fluctuate each week, and totals for individual titles can go up or down as we update our estimates.

Because sales figures are estimated based on sampling, they will be more accurate for higher-selling titles.