Box Office History for Blade Movies
Register with The Numbers for free to customize this chart.
| Release Date | Title | Production Budget | Opening Weekend | Domestic Box Office | Worldwide Box Office |
|---|---|---|---|---|---|
| Nov 7, 2025 | Blade | ||||
| Dec 8, 2004 | Blade: Trinity | $65,000,000 | $16,061,271 | $52,397,389 | $131,353,165 |
| Mar 22, 2002 | Blade 2 | $54,000,000 | $32,528,016 | $81,676,888 | $154,338,601 |
| Aug 21, 1998 | Blade | $45,000,000 | $17,073,856 | $70,141,876 | $131,237,688 |
| Averages | $54,666,667 | $21,887,714 | $68,072,051 | $138,976,485 | |
| Totals | 4 | $164,000,000 | $204,216,153 | $416,929,454 | |
Video Release Breakdown
| Release Date | Title | Domestic Video Sales to Date | Watch Now |
|---|---|---|---|
| Dec 22, 1998 | Blade | $524,700 | Netflix Amazon iTunes Google |
| Sep 3, 2002 | Blade 2 | $743,952 | Netflix Hulu |
| Apr 26, 2005 | Blade: Trinity | Netflix iTunes | |
| Mar 10, 2015 | Blade Trilogy | $3,470,227 | iTunes |
| Dec 31, 2025 | Blade | ||
| Totals | $4,738,879 | ||
Our DVD and Blu-ray sales estimates are based on weekly retail surveys, which we use to build a weekly market share estimate for each title we are tracking. The market share is converted into a weekly sales estimate based on industry reports on the overall size of the market, including reports published in Media Play News.
For example, if our weekly retail survey estimates that a particular title sold 1% of all units that week, and the industry reports sales of 1,500,000 units in total, we will estimate 15,000 units were sold of that title. The consumer spending estimate is based on the average sales price for the title in the retailers we survey.
We refine our estimates from week to week as more data becomes available. In particular, we adjust weekly sales figures for the quarter once the total market estimates are published by the Digital Entertainment Group. Figures will therefore fluctuate each week, and totals for individual titles can go up or down as we update our estimates.
Because sales figures are estimated based on sampling, they will be more accurate for higher-selling titles.
2018 Preview: February
February 1st, 2018
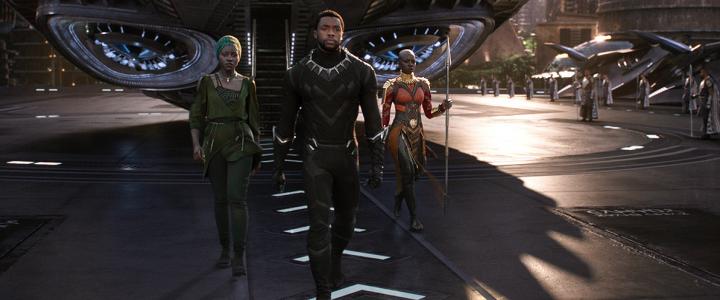
2018 got off to a good start and January more or less held its ground when compared to 2017. There were some misses, but surprise holdovers made up the difference. Looking forward, February will be dominated by Black Panther. In fact, it will very likely make more during its opening weekend than the second place film, Fifty Shades Freed, will likely make in total. Black Panther likely won’t break records, but it could come close, while Fifty Shade Freed and Peter Rabbit both have a 50/50 shot at $100 million. Last February, The Lego Batman Movie both earned $175 million, while Fifty Shades Darker earned over $100 million. Black Panther will easily beat any film from last February; in fact, it could earn more than the top two films earned combined. As long as the rest of the box office isn’t a complete disaster, February should help 2018 earn a significant edge over 2017 in the year-over-year comparisons.
More...
2016 Preview: February
February 1st, 2016
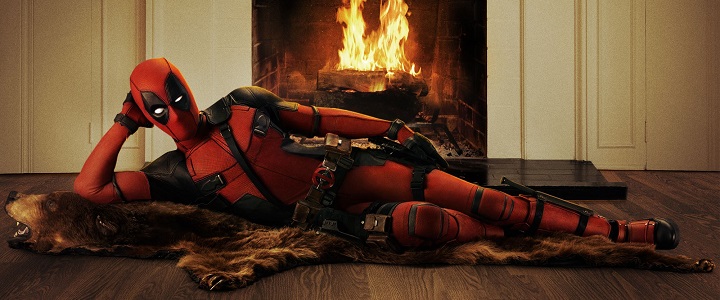
As expected, January was dominated by holdovers with Star Wars: The Force Awakens and The Revenant leading the way. That's not to say there were no new releases that did well, as Ride Along 2 and Kung Fu Panda 3 were hits with moviegoers. Looking forward, there is only one film that looks like a sure hit, Deadpool. There's a slim chance it could be a surprise $200 million hit. There's a much better chance it will be the only $100 million hit. Conversely, last February started with a $100 million hit coming out, The SpongeBob Movie: Sponge Out of Water, while there were two other $100 million movies to come out that month, Fifty Shades of Grey and Kingsman: The Secret Service. Looks like 2016 is going to lose in the year-over-year comparison.
More...
Note: This list contains actors who appeared in at least two movies in the franchise.
| Person | Nr. of Movies | Role | Franchise Worldwide Box Office | Career Worldwide Box Office | Franchise / Career |
|---|---|---|---|---|---|
| Wesley Snipes | 3 | Blade | $416,929,454 | $1,648,651,799 | 25.3% |
| Kris Kristofferson | 3 | Whistler | $416,929,454 | $1,670,193,779 | 25.0% |
| Matt Schulze | 2 | Chupa | $285,576,289 | $1,269,163,041 | 22.5% |
| Lennox Brown | 2 | Pleading Goon | $285,576,289 | $304,159,254 | 93.9% |
Note: This list contains people who contributed to at least two movies in the franchise.
| Person | Nr. of Movies | Technical Role | Franchise Worldwide Box Office | Career Worldwide Box Office | Franchise / Career |
|---|---|---|---|---|---|
| Peter Frankfurt | 3 | Producer (3) | $416,929,454 | $420,544,393 | 99.1% |
| David S. Goyer | 3 |
Written by (3) Director (1) Executive Producer (1) Producer (1) |
$416,929,454 | $5,607,621,032 | 7.4% |
| Wesley Snipes | 3 | Producer (3) | $416,929,454 | $444,024,259 | 93.9% |
| Lynn Harris | 3 |
Executive Producer (2) Producer (1) |
$416,929,454 | $1,367,626,355 | 30.5% |
| Stan Lee | 3 | Executive Producer (3) | $416,929,454 | $38,884,663,058 | 1.1% |
| Avi Arad | 3 | Executive Producer (3) | $416,929,454 | $14,082,375,794 | 3.0% |
| Gene Colan | 3 | Character Creator (3) | $416,929,454 | $416,929,454 | 100.0% |
| Kevin Feige | 2 |
Co-Producer (1) Producer (1) |
$131,353,165 | $34,662,913,625 | 0.4% |
| Toby Emmerich | 2 | Executive Producer (2) | $285,691,766 | $11,009,438,228 | 2.6% |
| Andrew J. Horne | 2 | Co-Producer (2) | $285,576,289 | $285,576,289 | 100.0% |
| Gabriel Beristain | 2 | Director of Photography (2) | $285,691,766 | $1,480,951,906 | 19.3% |
| Jon Divens | 2 | Co-Producer (2) | $285,576,289 | $285,576,289 | 100.0% |
| Michael Kamper | 2 | Sound Effects Editor (2) | $285,576,289 | $1,382,029,702 | 20.7% |
| Marv Wolfman | 2 | Character Creator (2) | $285,576,289 | $285,576,289 | 100.0% |
| Jeff Ward | 2 | Stunt Coordinator (2) | $285,576,289 | $781,038,373 | 36.6% |