Do I Sound Gay? (2015)

Do I Sound Gay poster
Theatrical Performance
Domestic Box Office $108,620Details
International Box Office $3,209Details
Worldwide Box Office $111,829
Further financial details...

Synopsis

After a break-up with his boyfriend, journalist David Thorpe embarks on a journey of self-discovery, confronting his anxiety about “sounding gay.” Enlisting acting coaches, linguists, friends, family, total strangers, and celebrities, he quickly learns that many people—both gay and straight—often wish for a different voice. What starts as a personal journey becomes a chance to unpack layers of cultural baggage concerning sexuality, identity, and self-esteem.

Metrics

Opening Weekend:$10,461 (9.6% of total gross)
Legs:4.02 (domestic box office/biggest weekend)
Domestic Share:97.1% (domestic box office/worldwide)
Theater counts:1 opening theaters/18 max. theaters, 2.2 weeks average run per theater
Infl. Adj. Dom. BO $138,890

Latest Ranking on Cumulative Box Office Lists

See the Box Office tab (Domestic) and International tab (International and Worldwide) for more Cumulative Box Office Records.


Movie Details

Domestic Releases: July 10th, 2015 (Limited) by IFC Films
International Releases: October 30th, 2015 (Wide) (United Kingdom)
MPAA Rating: Not Rated
Running Time: 77 minutes
Comparisons: vs. An Honest Liar
Create your own comparison chart…
Keywords: LGBTQ+, Crowdfunding, Directing Yourself, Early / Simultaneous Video-on-Demand release
Source:Based on Real Life Events
Genre:Documentary
Production Method:Live Action
Creative Type:Factual
Production/Financing Companies: ThinkThorpe, Little Punk
Production Countries: United States
Languages: English

Compare this performance with other movies…

Domestic Cumulative Box Office Records

Weekend Box Office Performance

DateRankGross% ChangeTheatersPer TheaterTotal GrossWeek
Jul 10, 2015 57 $10,461   1 $10,461   $10,461 1
Jul 17, 2015 57 $14,944 +43% 5 $2,989   $30,611 2
Jul 24, 2015 50 $27,000 +81% 17 $1,588   $66,000 3
Jul 31, 2015 60 $10,000 -63% 16 $625   $87,742 4

Daily Box Office Performance

Weekly Box Office Performance

DateRankGross% ChangeTheatersPer TheaterTotal GrossWeek
Jul 10, 2015 60 $15,617   1 $15,617   $15,617 1
Jul 17, 2015 58 $22,880 +47% 18 $1,271   $38,497 2
Jul 24, 2015 55 $39,245 +72% 18 $2,180   $77,742 3
Jul 31, 2015 62 $18,304 -53% 16 $1,144   $99,011 4
Aug 7, 2015 83 $4,397 -76% 7 $628   $103,408 5
Aug 14, 2015 82 $5,076 +15% 3 $1,692   $108,620 6

Box Office Summary Per Territory

Territory Release
Date
Opening
Weekend
Opening
Weekend
Screens
Maximum
Screens
Theatrical
Engagements
Total
Box Office
Report
Date
United Kingdom 10/30/2015 $3,209 6 6 6 $3,209 11/3/2015
 
International Total$3,209 11/3/2015

International Cumulative Box Office Records


Worldwide Cumulative Box Office Records


Full financial estimates for this film, including domestic and international box office, video sales, video rentals, TV and ancillary revenue are available through our research services. For more information, please contact us at research@the-numbers.com.

Interviewee(s)

Margaret Cho Herself
Tim Gunn Himself
Don Lemon Himself
Dan Savage Himself
David Sedaris Himself
George Takei Himself
David Thorpe Himself
Zach King Himself

For a description of the different acting role types we use to categorize acting perfomances, see our Glossary.

Production and Technical Credits

David Thorpe Director
David Thorpe Screenwriter
Howard Gertler Producer
David Thorpe Producer
Dan Cogan Executive Producer
Jenny Raskin Co-Producer
Nicholas Bussey Editor
Maeve O’Boyle Editor and Co-Writer
Matt Bockelman Director of Photography
John Turner Composer
David Briggs Sound Editor
Eric Hirsch Sound Mixer

Per Theater Chart: Tangerine Has Sweet Start

July 14th, 2015

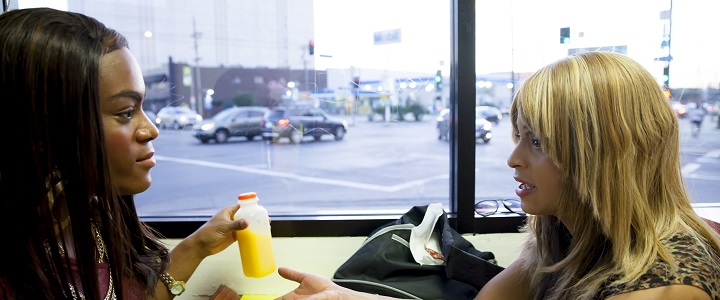
Tangerine

The $10,000 club was busier that it was last week with four films earning a per theater average of more than $10,000. This includes the overall number one film, Minions, which earned an average of $26,905 in over 4,000 theaters. The best limited release was Tangerine with an average $15,171 in four theaters. I thought this might be a little too niche to find a large audience, but perhaps I was wrong. Up next is Baahubali: The Beginning, which was also a surprise hit with an average of $13,559 in 236 theaters. It is very rare for a Bollywood film to do that well. The final film in the $10,000 club was Do I Sound Gay? with $11,000 in its lone theater. More...

Limited and VOD Releases: What Films to see on Our Holiday

July 10th, 2015

What We Did on Our Holiday

Very few movies on this week's list have a real shot at box office success. Stations of the Cross and Tangerine are both earning amazing reviews, but both are niche market releases. Many movies are also earning good reviews, like What We Did on Our Holiday, but are playing on VOD, so they likely won't find audiences in theaters. More...


  1. Summary
  2. News
  3. Box Office
  4. International
  5. Video Sales
  6. Full Financials
  7. Cast & Crew
  8. Trailer

Synopsis

After a break-up with his boyfriend, journalist David Thorpe embarks on a journey of self-discovery, confronting his anxiety about “sounding gay.” Enlisting acting coaches, linguists, friends, family, total strangers, and celebrities, he quickly learns that many people—both gay and straight—often wish for a different voice. What starts as a personal journey becomes a chance to unpack layers of cultural baggage concerning sexuality, identity, and self-esteem.

Metrics

Opening Weekend:$10,461 (9.6% of total gross)
Legs:4.02 (domestic box office/biggest weekend)
Domestic Share:97.1% (domestic box office/worldwide)
Theater counts:1 opening theaters/18 max. theaters, 2.2 weeks average run per theater
Infl. Adj. Dom. BO $138,890

Latest Ranking on Cumulative Box Office Lists

See the Box Office tab (Domestic) and International tab (International and Worldwide) for more Cumulative Box Office Records.


Movie Details

Domestic Releases: July 10th, 2015 (Limited) by IFC Films
International Releases: October 30th, 2015 (Wide) (United Kingdom)
MPAA Rating: Not Rated
Running Time: 77 minutes
Comparisons: vs. An Honest Liar
Create your own comparison chart…
Keywords: LGBTQ+, Crowdfunding, Directing Yourself, Early / Simultaneous Video-on-Demand release
Source:Based on Real Life Events
Genre:Documentary
Production Method:Live Action
Creative Type:Factual
Production/Financing Companies: ThinkThorpe, Little Punk
Production Countries: United States
Languages: English

Interviewee(s)

Margaret Cho Herself
Tim Gunn Himself
Don Lemon Himself
Dan Savage Himself
David Sedaris Himself
George Takei Himself
David Thorpe Himself
Zach King Himself

For a description of the different acting role types we use to categorize acting perfomances, see our Glossary.

Production and Technical Credits

David Thorpe Director
David Thorpe Screenwriter
Howard Gertler Producer
David Thorpe Producer
Dan Cogan Executive Producer
Jenny Raskin Co-Producer
Nicholas Bussey Editor
Maeve O’Boyle Editor and Co-Writer
Matt Bockelman Director of Photography
John Turner Composer
David Briggs Sound Editor
Eric Hirsch Sound Mixer

Per Theater Chart: Tangerine Has Sweet Start

July 14th, 2015

Tangerine

The $10,000 club was busier that it was last week with four films earning a per theater average of more than $10,000. This includes the overall number one film, Minions, which earned an average of $26,905 in over 4,000 theaters. The best limited release was Tangerine with an average $15,171 in four theaters. I thought this might be a little too niche to find a large audience, but perhaps I was wrong. Up next is Baahubali: The Beginning, which was also a surprise hit with an average of $13,559 in 236 theaters. It is very rare for a Bollywood film to do that well. The final film in the $10,000 club was Do I Sound Gay? with $11,000 in its lone theater. More...

Limited and VOD Releases: What Films to see on Our Holiday

July 10th, 2015

What We Did on Our Holiday

Very few movies on this week's list have a real shot at box office success. Stations of the Cross and Tangerine are both earning amazing reviews, but both are niche market releases. Many movies are also earning good reviews, like What We Did on Our Holiday, but are playing on VOD, so they likely won't find audiences in theaters. More...

Compare this performance with other movies…

Domestic Cumulative Box Office Records

Weekend Box Office Performance

DateRankGross% ChangeTheatersPer TheaterTotal GrossWeek
Jul 10, 2015 57 $10,461   1 $10,461   $10,461 1
Jul 17, 2015 57 $14,944 +43% 5 $2,989   $30,611 2
Jul 24, 2015 50 $27,000 +81% 17 $1,588   $66,000 3
Jul 31, 2015 60 $10,000 -63% 16 $625   $87,742 4

Daily Box Office Performance

Weekly Box Office Performance

DateRankGross% ChangeTheatersPer TheaterTotal GrossWeek
Jul 10, 2015 60 $15,617   1 $15,617   $15,617 1
Jul 17, 2015 58 $22,880 +47% 18 $1,271   $38,497 2
Jul 24, 2015 55 $39,245 +72% 18 $2,180   $77,742 3
Jul 31, 2015 62 $18,304 -53% 16 $1,144   $99,011 4
Aug 7, 2015 83 $4,397 -76% 7 $628   $103,408 5
Aug 14, 2015 82 $5,076 +15% 3 $1,692   $108,620 6

Box Office Summary Per Territory

Territory Release
Date
Opening
Weekend
Opening
Weekend
Screens
Maximum
Screens
Theatrical
Engagements
Total
Box Office
Report
Date
United Kingdom 10/30/2015 $3,209 6 6 6 $3,209 11/3/2015
 
International Total$3,209 11/3/2015

International Cumulative Box Office Records


Worldwide Cumulative Box Office Records


Full financial estimates for this film, including domestic and international box office, video sales, video rentals, TV and ancillary revenue are available through our research services. For more information, please contact us at research@the-numbers.com.