Box Office History for Blair Witch Project Movies
Register with The Numbers for free to customize this chart.
| Release Date | Title | Production Budget | Opening Weekend | Domestic Box Office | Worldwide Box Office |
|---|---|---|---|---|---|
| Sep 16, 2016 | Blair Witch | $10,000,000 | $9,576,057 | $20,777,061 | $38,985,577 |
| Oct 27, 2000 | Book of Shadows: Blair Witch 2 | $15,000,000 | $13,223,887 | $26,421,314 | $47,721,314 |
| Jul 14, 1999 | The Blair Witch Project | $600,000 | $1,512,054 | $140,539,099 | $248,300,000 |
| Averages | $8,533,333 | $8,103,999 | $62,579,158 | $111,668,964 | |
| Totals | 3 | $25,600,000 | $187,737,474 | $335,006,891 | |
Video Release Breakdown
| Release Date | Title | Domestic Video Sales to Date | Watch Now |
|---|---|---|---|
| Feb 20, 2001 | Book of Shadows: Blair Witch 2 | ||
| Oct 5, 2010 | The Blair Witch Project | iTunes Google | |
| Jan 3, 2017 | Blair Witch | $2,553,323 | Netflix Amazon iTunes Google Vudu |
| Totals | $2,553,323 | ||
Our DVD and Blu-ray sales estimates are based on weekly retail surveys, which we use to build a weekly market share estimate for each title we are tracking. The market share is converted into a weekly sales estimate based on industry reports on the overall size of the market, including reports published in Media Play News.
For example, if our weekly retail survey estimates that a particular title sold 1% of all units that week, and the industry reports sales of 1,500,000 units in total, we will estimate 15,000 units were sold of that title. The consumer spending estimate is based on the average sales price for the title in the retailers we survey.
We refine our estimates from week to week as more data becomes available. In particular, we adjust weekly sales figures for the quarter once the total market estimates are published by the Digital Entertainment Group. Figures will therefore fluctuate each week, and totals for individual titles can go up or down as we update our estimates.
Because sales figures are estimated based on sampling, they will be more accurate for higher-selling titles.
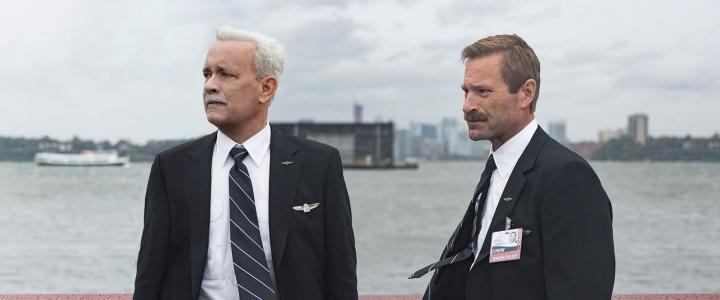
Weekend Wrap-Up: Sully Saves the Weekend, Again, with $21.65 million
September 19th, 2016
-3-News.jpg)
Sully led the way on the weekend box office chart matching predictions nearly perfectly with $21.65 million. Unfortunately for the overall box office, it wasn’t a close race as both Blair Witch and Bridget Jones’s Baby really struggled. This caused the overall box office to fall 12% from last weekend to just $89 million. Worse still, this weekend last year, the box office was rebounding and because of that, 2016 lost the year-over-year comparison by 21%. Year-to-date, 2016 is still ahead of 2015 by a substantial margin of 6.6% or $510 million. To emphasize, a lead of $8.22 billion to $7.71 billion and 2016 would really have to blow it to end up behind 2015 in the end. However, if things don’t turn around soon, this becomes more and more likely.
More...
Theater Counts: Sully Starts the Fall Season
September 8th, 2016
Fall Season starts in lively style this weekend with an impressively wide release for Sully. The Clint Eastwood/Tom Hanks drama will open in 3,525 theaters, the most for a new release since Pete’s Dragon almost a month ago. That film’s $21 million opening will be the minimum benchmark for Sully.
More...
2016 Preview: September
September 1st, 2016
-1-News.jpg)
August continued to pad 2016’s lead over 2015 in the year-over-year comparison. It managed this feat almost entirely due to Suicide Squad, which is on pace to hit $300 million. The next best film was Sausage Party, which might make $100 million, if it gets a push over the top. September won’t be as strong as that. This is no surprise, as the month is one of the biggest dumping grounds on the calendar. That said, studios have been working to make the end of the month a lot more productive and there are a few potential hits. The biggest of these is The Magnificent Seven, which is expected to crack $100 million, maybe even $150 million. Meanwhile, Sully and Storks both have a limited chance at $100 million. Last September, the biggest release of the month was Hotel Transylvania 2 with pulled in $169.70 million. I don’t think The Magnificent Seven will match that, so we might need a surprise $100 million hit for 2016 to come out on top.
More...
Note: This list contains actors who appeared in at least two movies in the franchise.
Note: This list contains people who contributed to at least two movies in the franchise.
| Person | Nr. of Movies | Technical Role | Franchise Worldwide Box Office | Career Worldwide Box Office | Franchise / Career |
|---|---|---|---|---|---|
| Daniel Myrick | 2 |
Director (1) Executive Producer (1) |
$287,285,577 | $287,288,129 | 100.0% |
| Eduardo Sanchez | 2 |
Director (1) Executive Producer (1) |
$287,285,577 | $287,729,030 | 99.8% |
| Gregg Hale | 2 |
Producer (1) Executive Producer (1) |
$287,285,577 | $287,722,808 | 99.8% |