March 25th, 2014
It is a good, but very shallow week on the home market. The Wolf of Wall Street is leading the pack, with the Blu-ray Combo Pack earning first place and DVD earning second. This is a $100 million hit and a multi-Oscar nominee, so it is not surprising it is earning the top two spots. On the other hand, third place currently belongs to Monster High: Frights, Camera, Action! on DVD. That's a real sign that it is a shallow week. That's not to say some of the smaller releases are not worth picking up. Mystery Science Theater 3000: XXIX is certainly a contender for Pick of the Week, but in the end I went with The Wolf of Wall Street. On a side note, Continuum: Season 2 on Blu-ray earned the Puck of the Week, for Best Canadian Release.
More...
March 23rd, 2014
I don't think it is unfair to call The Book Thief Oscar-bait. It's a costume drama that deals with the Holocaust, albeit indirectly. Unfortunately, its reviews were mixed, to be kind, so becoming an Awards Season player was out of the question. It did pick up a few nominations here and there, mostly for the score, but also a few for Sophie Nelisse's performance. In the end, it earned more than $20 million, which is amazing for a film that started in limited release. So were critics right in giving the film mixed reviews? Or is there a reason so many people saw it in theaters?
More...
March 10th, 2014
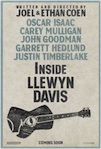
If you look over at Amazon.com, the best-selling new release of the week is The Book Thief. This film made just over $20 million at the box office, which is amazing for a limited release. However, it is still a limited release on top of the new releases. That tells you how slow this week is on the home market. Fortunately, last Friday The Hunger Games: Catching Fire came out on DVD or Blu-ray Combo Pack and I'm including it on this week's list as well. There are a number of other releases that are worth picking up, including The Patience Stone on DVD, In Fear on DVD, and Inside Llewyn Davis on Blu-ray. However, while there is some competition, The Hunger Games: Catching Fire on Blu-ray Combo Pack is the Pick of the Week.
More...
January 22nd, 2014
The only film to top $10,000 on this week's per theater chart was Ride Along, which earned an average of $15,590. This is an amazing result for a January release. In fact, it would have been amazing for a limited release.
More...
January 16th, 2014
The Oscar nominations were announced this morning and there are some surprises mixed in with the predictable results. Gravity and American Hustle led the way with ten nominations each while 12 Years a Slave was right behind with nine. The fact that 12 Years a Slave wasn't the leader is the first of the surprises.
More...
January 7th, 2014
It was a slow week for new releases as none topped $10,000 on the per theater chart. There were some holdovers that performed well, led by Lone Survivor, which pulled in an average of $42,429 in two theaters. This is compared to $45,436 during its opening weekend. Such a small decline is great news for its upcoming wide expansion. August: Osage County was next with an average of $27,983 in five theaters, which is 22% lower than its opening average of $35,860. Its running tally is already at nearly half a million and it has potential to expand, especially if it continues to do well during Awards Season. The final film in the $10,000 club was Her with an average of $15,378 in 47 theaters. It is already at nearly $3 million after three weeks of release and it expands wide this weekend.
More...
December 14th, 2013
Hollywood Foreign Press Association announced their Golden Globe nominations this week, and a clear picture is forming. 12 Years a Slave was again the recipient of the most nominations, but this time it was a tie, as it and American Hustle both grabbed seven nominations. If you look down the list of other multi-nominated films, you will find a number of familiar faces.
More...
December 12th, 2013
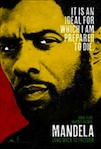
Inside Llewyn Davis had an incredible opening earning more than $400,000 in four theaters for a per theater average of $101,353. This is the third best per theater for the year behind just Frozen and Blue Jasmine. Mandela Long Walk to Freedom had a strong hold with an average of $19,413 in four theaters. The reason for this is obvious, but a little ghoulish to talk about.
More...
December 8th, 2013
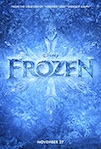
Frozen will come out the winner at the box office this weekend, topping Catching Fire $31.6 million to $27 million, according to studio estimates released on Sunday. Both films are down over 50% from last weekend's holiday frame, but Frozen enjoys an advantage as the more seasonal of the two and will likely maintain its lead, at least until The Hobbit blows them both away on Friday.
More...
December 4th, 2013
Mandela Long Walk to Freedom earned first place on the per theater chart with an average of $21,071 in four theaters. However, its reviews are only good, not great, and it likely won't have great legs. Frozen and The Hunger Games: Catching Fire were neck and neck with averages of $18,009 and $17,819 respectively.
More...
November 27th, 2013
Thanksgiving long weekend won't be remembered for the quality of the films opening wide. In fact, of the three new releases on this week's list, only one of them is truly opening wide. Homefront is debuting in 2,500 theaters, while Black Nativity is only opening in 1,500. Oldboy is only opening in 600 theaters, but it still has a reasonable shot at the top ten. If it weren't for the wide expansion of Frozen and hopefully a strong hold by The Hunger Games: Catching Fire, the weekend would be a write-off. As it is, 2013 should crush 2012... mostly because there is a misalignment and this weekend last year was the weekend after Thanksgiving. The post holiday slump meant the top five was only able to bring in a little under $75 million. I'm not saying Catching Fire will top that number, at least not over three days, but it should clear at least that much over the next five days.
More...
November 26th, 2013
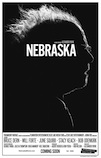
Frozen begun its short prestige release before its wide expansion on Wednesday and it was fantastic. The film pulled in $243,390 in one theater giving it the best per theater average for the year so far, topping Blue Jasmine and pushing Spring Breakers into third place. The Hunger Games: Catching Fire was in a distant second place with an average of $37,971 in more than 4,000 theaters. Philomena did very well with an average of $32,109 in four theaters. The Great Beauty remained in the $10,000 club with an average of $17,452 in three theaters. Nebraska rounded out the $10,000 club with an average of $11,634 in 28 theaters. It should continue to expand and start hitting major milestones.
More...
November 20th, 2013
Nebraska led the way on the per theater average with an average of $35,100 in four theaters. This is not as strong as Alexander Payne's previous release, especially if you take into account the difference in the theater count between the two films. The Great Beauty was next with $23,442 in its lone theater. The Best Man Holiday was the only wide release to crack the $10,000 club earning an average of $14,875 during its opening weekend. The Book Thief and The Christmas Candle were right behind with averages of $14,501 and $14,140 respectively.
More...
November 17th, 2013
Although it's still the calm before the storm that will be Catching Fire next weekend, this weekend has a healthy look to it thanks to a stronger-than-expected debut for The Best Man Holiday, which will post about $30.5 million according to Universal's Sunday projection, more than three times the debut figure for the previous film in the franchise. That won't be enough to unseat Thor at the top of the chart though. The Marvel superhero will post about $38 million, down a reasonable 55% from its opening frame. Most other returning films are enjoying good holds too.
More...
November 12th, 2013
The Book Thief was a surprise top spot with an average of $26,251 in four theaters. It was seen by some as a possible Awards Season contender, but its reviews suggest otherwise. Thor: The Dark World was first on the overall box office and second on the per theater chart with $22,322. Dallas Buyers Club fell from first to third on the per theater chart, but with a still strong average of $18,249 in 35 theaters.
More...
November 10th, 2013
Thor: The Dark World gets the holiday season off to a start this weekend with a powerful display at the box office. Disney is pegging its opening weekend at $86.8 million, which will be a healthy 30% boost from the debut of the first film in the franchise and also one of the ten biggest weekends in November. It's the first film in the Avengers über-franchise to open outside of the May-July Summer season, but that certainly doesn't seemed to have harmed it at the box office, and it won't have much competition until Catching Fire opens in a couple of weeks' time. All said, it looks a virtual certainty to top the box office performance of the original.
More...
November 8th, 2013
There are quite a few limited releases on this week's list, including several that have earned more pre-release buzz that most limited releases earn. However, many of these films' reviews are good, but not great. The Book Thief is one such film, but it could still find an audience in limited release, although its plans to expand wide are very unlikely to happen. How I Live Now and Great Expectations are in similar positions.
More...
November 1st, 2013
October ended on a winning note, but it was the only time the entire month that 2013 topped 2012 in the year-over-year comparison. This is quite shocking, as Gravity crushed expectations with more than $200 million and counting. Even with that surprise monster hit, the month still couldn't keep pace with last year. Compared to October, November looks a lot better with three films that could be monster hits: Frozen, Thor: The Dark World, and The Hunger Games: Catching Fire. On the other hand, those are the only three movies with a 50/50 chance or better to top $100 million compared, while there were seven films that reached that milestone last November. The Hunger Games: Catching Fire should make more than last year's number one film, Skyfall, but the depth last year could prove too much to deal with. 2013 might dip below last year's pace sometime during the month, but hopefully it won't stay there too long.
More...